Hyperglycemia, the defining feature of diabetes, is a fundamental cause of vascular target-organ complications, including kidney disease. Intensive treatment of hyperglycemia prevents DKD and may slow the progression of established kidney disease.
2.1 Target HbA1c for people with diabetes should be < 7.0%, irrespective of the presence or absence of CKD. (A)
Diabetes mellitus is the most common cause of kidney failure in the United States4 and is among the most common causes in the rest of the world. A large number of epidemiological studies and controlled trials have defined risk factors for progression of DKD and response to treatment.3 The purpose of this guideline is to review this literature with respect to glycemic control and translate the results into practical strategies for clinicians who treat people with diabetes and CKD, either due to DKD or other causes.
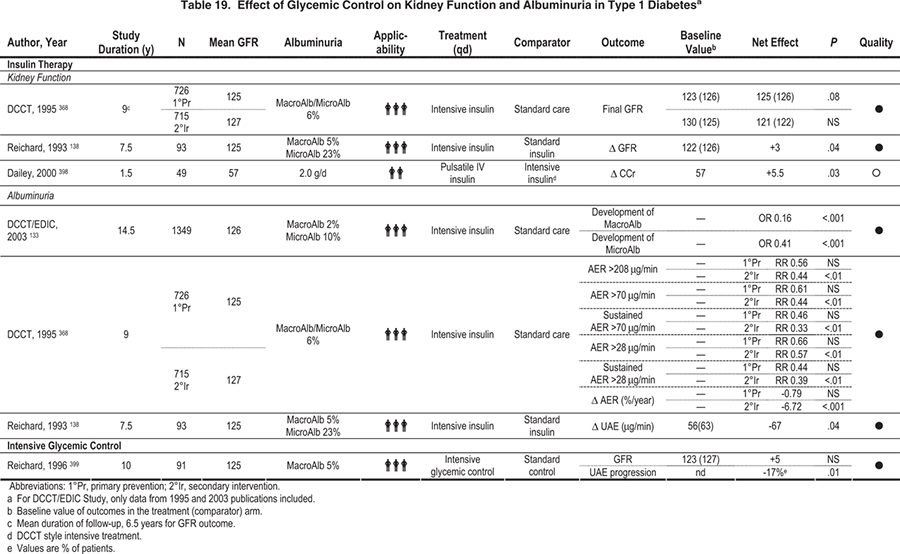
Most of the evidence for this guideline comes from studies of intensive glycemic control in people with type 1 and 2 diabetes and CKD stages 1 and 2 (Table 19 and Table 20). End points include the initial development of microalbuminuria (urinary albumin excretion between 30 and 300 mg/24 h or 30 and 300 mg/g creatinine), progression to macroalbuminuria (>300 mg/24 h or >300 mg/g creatinine), and change in kidney function. Very few studies addressed the benefits and risks of intensive glycemic control in later stages of CKD, let alone in patients who are undergoing dialysis or have received kidney transplants.
Lowering HbA1c levels to approximately 7.0% reduces the development of microalbuminuria. (Strong)
Type 1 Diabetes (Table 19)
A number of observational studies have shown that poorer glycemic control predicts the development of microalbuminuria.353-359 Several small prospective intervention studies from the early 1980s also showed that improved glycemic control reduced the development and progression of elevated albuminuria; however, in most cases, the small sizes of the cohorts precluded statistically significant changes.360-366 A meta-analysis of these studies concluded that intensive therapy significantly reduced the risk of nephropathy progression (odds ratio [OR], 0.34; 95% CI, 0.20 to 0.58; P < 0.001).367 The DCCT was a multicenter randomized clinical trial of 1,441 subjects with type 1 diabetes that compared the effects of intensive glucose control with conventional treatment on the development and progression of the long-term complications of type 1 diabetes.132 At baseline, mean HbA1c levels were similar in both treatment groups. By 3 months after randomization, mean HbA1c level was approximately 2% lower in the intensive-treatment group than the conventional-treatment group, and this difference was maintained throughout the study (7.2% versus 9.1%; P < 0.001).132 After a mean of 6.5 years, intensive therapy reduced the occurrence of microalbuminuria by 34% (95% CI, 2% to 56%) in the primary-prevention group (no retinopathy and urinary AER < 28 µg/min at baseline) and by 43% (95% CI, 21% to 58%) in the secondary-intervention group, who had early complications at baseline (background retinopathy with or without microalbuminuria, but normal GFR; Fig 8). 132, 368 To assess whether their reduced risk of DKD persisted long term, 1,349 of these subjects were evaluated as part of the EDIC study at the year 7 to 8 post-DCCT visit.133 Data were analyzed according to the original intensive- versus conventional-treatment groups, and the primary-prevention and secondary-intervention cohorts were combined. The previous difference in HbA1c levels for the intensive versus conventional group (7.2% and 9.1%, respectively) in the DCCT gradually narrowed during the first 2 years in the follow-up period and then remained near 8% for both groups for the subsequent 6 years. Eighty-seven new cases of microalbuminuria (15.8%) occurred in the conventional-treatment group, and 39 (6.8%), in the intensive-treatment group, for an RR reduction of 59% (95% CI, 39% to 73%, P < 0.0001; Fig 9) .

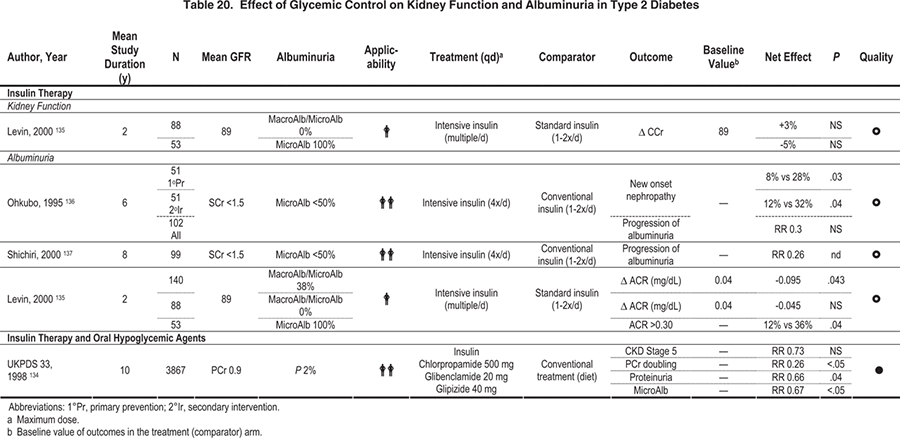
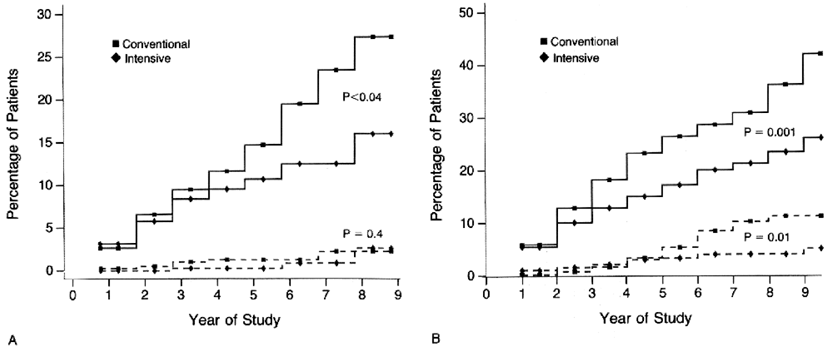
Figure 8. Cumulative Incidence of Urinary Albumin Excretion of 300 mg/24 h or Greater and 40 mg/24 h or Greater in Patients with Type 1 Diabetes Mellitus Receiving Intensive or Conventional Therapy.
(A) In the primary-prevention cohort, intensive therapy reduced the adjusted mean risk of microalbuminuria by 34% (P <
0.04). (B) In the secondary-intervention cohort, patients with urinary albumin excretion of 40 mg/24 h or greater at baseline were excluded from the analysis of the development of microalbuminuria. Intensive therapy reduced the adjusted mean risk of albuminuria by 56% (P < 0.01) and the risk of microalbuminuria by 43% (P < 0.001) compared with conventional therapy.
Reprinted with permission.132
Type 2 Diabetes (Table 20)
Observational studies have shown a similar association of poor glycemic control with the development of elevated albuminuria in type 2 diabetes.369-373 Three major intervention studies also have been carried out. In a study design similar to the DCCT, the Kumamoto study separated 110 Japanese subjects with type 2 diabetes into primary-prevention and secondary-intervention cohorts and then randomly assigned them to intensive (HbA1c, 7.1%) or conventional (HbA1c, 9.4%) glycemic control with insulin.136 During the 6-year study period, a significant reduction of both new-onset and progressive DKD was found in subjects who received intensive glycemic control. In the prevention cohort, 7.7% of subjects in the intensive-treatment group developed elevated albuminuria versus 28.0% in the conventional-treatment group (P = 0.03; Fig 10). After 8 years, the proportions developing microalbuminuria were 11.5% and 43.5%, respectively (Fig 11). 137 The UKPDS randomly assigned newly diagnosed patients with type 2 diabetes to intensive management using a sulfonylurea or insulin or to conventional management with diet alone. Average HbA1c level for the intensive group was 7.0% compared with 7.9% for the conventional group during the study.134 After 9 years of intensive therapy, RR reduction for the development of microalbuminuria was 24% (95% CI, 9% to 38%; P = 0.0006).134 No difference in risk reduction was seen whether intensive therapy was achieved with sulfonylurea or insulin.116 In the Veterans Affairs (VA) Cooperative Study on Glycemic Control and Complications in Type 2 Diabetes Feasibility Trial, 95 men with a mean duration of diabetes of 7.8 years and no microalbuminuria were randomly assigned to intensive diabetes control (mean HbA1c, 7.1% at 2 years) or conventional control (mean HbA1c, 9.2% at 2 years). In this study, 17% of the intensively treated group developed microalbuminuria, whereas 35% of the conventionally treated group developed microalbuminuria after 2 years (P = 0.05).135
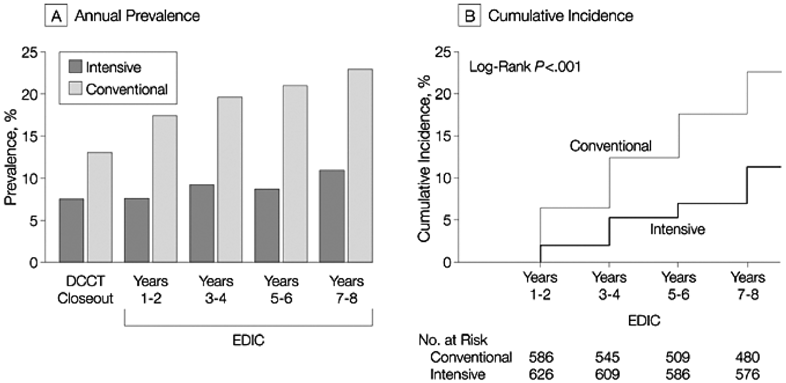
Figure 9. Prevalence and Cumulative Incidence of Microalbuminuria.
Microalbuminuria defined as AER of 28 µg/min or greater, equivalent to 40 mg/24 h. (A) Prevalence at the end of the DCCT and during the EDIC Study. Differences between the 2 treatment groups are significant at each time after DCCT closeout (P < 0.001). (B) Cumulative incidence of new cases in the EDIC Study for participants in the intensive- and conventionaltreatment groups with normal albuminuria at the beginning and end of the DCCT. The difference in cumulative incidences is significant by the log-rank test (P < 0.001). Reprinted with permission.133
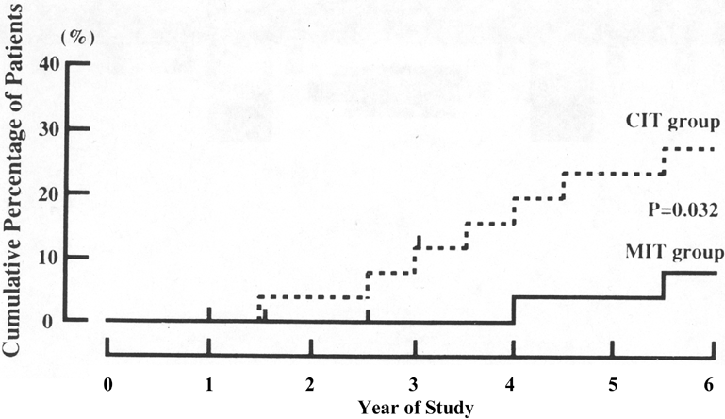
Figure 10. Cumulative Incidence of DKD After 6 Years of Follow-up in Patients with Type 2 Diabetes Treated by Intensive (solid line) and Conventional (dashed line) Insulin Injection Therapy in the Primary-Prevention Cohort of the Kumamoto Study.
Dropout patients are indicated by short vertical lines on the solid and dashed lines. Abbreviations: MIT, multiple insulin injection therapy group; CIT, conventional insulin injection therapy group. Reprinted with permission.136
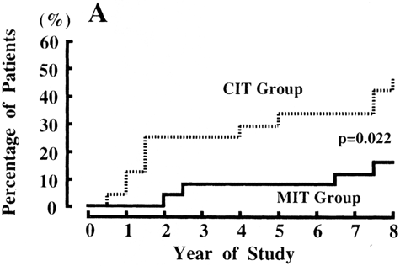
Figure 11. Cumulative Incidence of DKD After 8 Years of Follow-up in Patients with Type 2 Diabetes Treated by Intensive (solid line) and Conventional (dashed line) Insulin Injection Therapy in the Primary-Prevention Cohort of the Kumamoto Study.
Dropout patients are indicated by short vertical lines on the solid and dashed lines. Abbreviations: MIT, multiple insulin injection therapy group; CIT, conventional insulin injection therapy group. Reprinted with permission.137
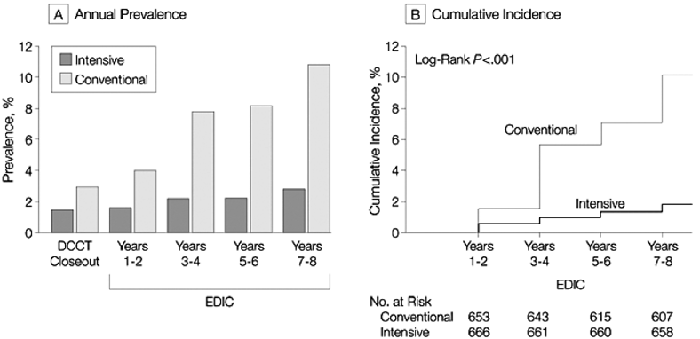
Figure 12. Prevalence and Incidence of Albuminuria.
Albuminuria was defined as AER of 208 µg/min or greater, equivalent to 300 mg/24 h. (A) Prevalence of clinical albuminuria at the end of the DCCT and during the EDIC Study. Differences between treatment groups are significant at each time point after DCCT close-out (P < 0.01). (B) Cumulative incidence of new cases in the EDIC Study for participants in the intensiveand conventional-treatment groups with either normoalbuminuria or microalbuminuria at the end of the DCCT. The difference in cumulative incidences is significant (P < 0.001). Reprinted with permission.133
Lowering HbA1c levels to approximately 7.0% reduces the development of macroalbuminuria. (Moderate)
Type 1 Diabetes (Table 19)
In the DCCT, new cases of macroalbuminuria occurred in 5.6% of the conventional-treatment group and 0.8% of the intensive-treatment group, for an RR reduction of 84% (95% CI, 58% to 94%; P = 0.0002; Fig 8).132, 368 For those who progressed from microalbuminuria to macroalbuminuria, intensive therapy also reduced the RR significantly (83%; 95% CI, 21% to 96%; P = 0.0236).132, 368 In the EDIC follow-up study, 8 years after the end of the DCCT, previous intensive therapy within the DCCT was associated with only 9 cases (1.4%) of macroalbuminuria versus 59 cases (9.4%) in the previous conventional-therapy group, an RR of 84% (95% CI, 67% to 92%; Fig 12). 133 In the similarly designed Stockholm study of 102 patients with type 1 diabetes, intensive insulin therapy resulting in a mean HbA1c of 7.1% was associated with macroalbuminuria in only 1 of 48 patients (2.1%), whereas conventional therapy, resulting in a mean HbA1c of 8.5%, was associated with macroalbuminuria in 9 of 54 patients (16.6%; P = 0.01).138
Type 2 Diabetes (Table 20)
In type 2 diabetes, data from the Kumamoto study showed that 11.5% of the intensive-treatment group progressed to macroalbuminuria versus 32.0% of the conventional-treatment group (P = 0.04).136 In the long-term follow-up of participants in the Kumamoto study, 2 years after completion of the original randomized trial, the difference in HbA1c was maintained, as was the significant reduction in the development of macroalbuminuria (16% in the previous intensive group and 40% in the previous conventional group; P = 0.04).137 In the UKPDS, the RR reduction for the development of macroalbuminuria with insulin or sulfonylureas was 33% at 9 years (4.4% versus 6.5%, intensive versus conventional), but this finding was not statistically significant.134 In the VA study, 12% of those in the intensive-treatment group who entered with microalbuminuria progressed to macroalbuminuria, whereas 36% of those in the conventional-treatment group progressed in this fashion (P = 0.04).135
For all these studies in both type 1 and type 2 diabetes, the overall numbers of individuals with microalbuminuria who developed macroalbuminuria were small, but less with intensive therapy. Accordingly, differences in progression rates from microalbuminuria to macroalbuminuria with intensive therapy compared with conventional treatment generally were not statistically significant, although the trends were to reduce progression.
Lowering HbA1c levels to approximately 7.0% reduces the rate of decrease in GFR. (Weak)
A few long-term observational studies have shown that poorer glycemic control is associated with a greater rate of decrease in GFR in patients with type 1 diabetes.374-376 In studies of other interventions, such as ACE inhibitors or ARBs, HbA1c levels often were included as covariates. In the Collaborative Study Group (CSG) analysis of the early captopril trial of patients with type 1 diabetes and CKD stages 2 to 3 (inferred from GFR and proteinuria levels), a higher HbA1c level was associated with an increased risk of doubling of serum creatinine concentration.377 A correlation (r = 0.69; P = 0.01) between HbA1c level and rate of decrease in GFR also was found in a similar analysis of a much smaller group of patients followed up at the Steno Diabetes Center who were being treated with ACE inhibitors.378
Most prospective randomized studies used as evidence for the effect of glycemic control on kidney function are limited by the small number of patients reaching an outcome of a decrease in GFR. In a study of only 6 patients with type 1 diabetes in whom the rate of decrease in GFR was compared before and after institution of intensive insulin therapy, the change from 1.35 ± 0.31 to 0.69 ± 0.13 mL/min/mo was not statistically significant, probably because of the small number of subjects.141 Another study found that more intensive glycemic treatment with just a modest decrease in HbA1c of 1.2% resulted in preservation of GFR during 2 years compared with a usual-treatment group.140 None of 48 patients in the intensive-treatment group and 6 of 54 in the conventional-treatment group in the Stockholm study decreased their GFR (P = 0.02).138 In the EDIC/DCCT follow-up study, 0.7% of the previously intensive-treatment group and 2.8% of the previously conventional-treatment group developed serum creatinine concentrations of 2.0 mg/dL or greater (P = 0.004), and 1% versus 4%, respectively, developed measured creatinine clearance values less than 70 mL/min/1.73 m2 (P < 0.001).133 For patients with type 2 diabetes, intensive treatment in the UKPDS was associated with a 67% risk reduction for a doubling of plasma creatinine levels at 9 years (0.71% of the intensive group and 1.76% of the conventional group; P = 0.027).134 In a small randomized study from Italy, 34 patients with type 2 diabetes who underwent intensive treatment with insulin and achieved an HbA1c level of 7.0% stabilized their rate of decrease in GFR, whereas those randomly assigned to metformin achieved an HbA1c of 8.0% and had a greater decrease in GFR during a 4-year period.139
Thiazolidinediones may have unique properties that reduce albuminuria. (Weak)
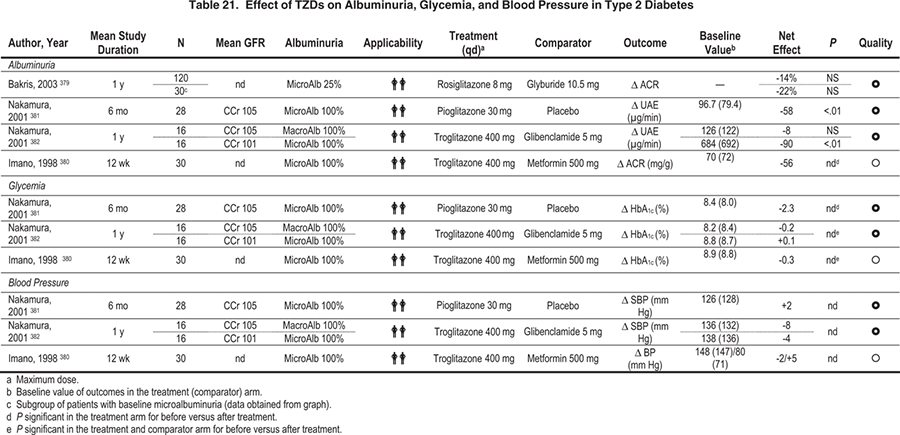
Several relatively small short-term studies have evaluated whether thiazolidinediones (TZDs) decrease albuminuria more than standard therapy with other oral agents (metformin or sulfonylureas) or dietary treatment for hyperglycemia in patients with type 2 diabetes and microalbuminuria (Table 21).379-382 Albuminuria was decreased or trends in this direction were observed with TZD treatment in all these studies. Whether this putative benefit was caused by better control of risk factors or the TZDs per se is not clear from the available evidence because TZD treatment was associated with larger decreases in glycemia or correlated with decreases in blood pressure.379,381,382
This guideline is consistent with the ADA guidelines,34 which recommend that adults with diabetes achieve an HbA1c level less than 7.0% or as close to normal as possible without excessive episodes of hypoglycemia, with the goal of reducing all complications of diabetes. Although the ADA does not have a separate guideline for patients with DKD, it recognizes that certain populations may require special considerations and that less intensive glycemic goals may be indicated in patients with severe or frequent hypoglycemia. The American Association of Clinical Endocrinologists, the International Diabetes Federation Global Guidelines, and the European NIDDM Working Group proposed that the HbA1c goal be less than 6.5% (www.rbh.nthames.nhs.uk/PRESTIGE/niddm/niddm.htm; last accessed 7/27/2006).383 Again, this level is recommended with the goal of reducing all complications of diabetes. None of these organizations has a separate guideline specific to DKD.
An overall glycemic goal for people with diabetes of less than 7.0% is very strongly supported by substantial data from large prospective randomized studies of both type 1 and type 2 diabetes. Much of this support stems from benefits for some of the other major complications of diabetes, especially retinopathy. With respect to kidney outcomes, data are very strong for the development of microalbuminuria. The numbers of patients progressing to more advanced outcomes, such as macroalbuminuria and decreases in GFR, are decreased significantly with improved glycemic control, but much of this decrease is related to the smaller number developing microalbuminuria to begin with. Nonetheless, even for those with more advanced disease, evidence supports reaching the recommended HbA1c target.
Drug Therapies
The major risk for patients attaining HbA1c levels less than 7.0% is the increasing development of hypoglycemia with lower glucose concentrations. This is particularly true for those with type 1 diabetes being treated with insulin.132, 138, 384 Although the risk is increased in those with type 2 diabetes being treated with insulin,134, 137 the magnitude of the risk is considerably less. The UKPDS also showed that sulfonylureas are associated with a small risk of hypoglycemia.134
Special Considerations in CKD Stages 3 to 5
Patients with decreased kidney function (CKD stages 3 to 5) have increased risks for hypoglycemia for 2 reasons: (1) decreased clearance of insulin and some of the oral agents used to treat diabetes, and (2) impaired kidney gluconeogenesis. With reduced kidney mass, the amount of gluconeogenesis carried out by the kidney is decreased.142 This reduction in gluconeogenesis may reduce the ability of a patient who is becoming hypoglycemic as the result of excessive insulin/oral agent dosage or lack of food intake to defend against hypoglycemia. However, this effect is difficult to quantify. About one third of insulin degradation is carried out by the kidney, and impaired kidney function is associated with a prolonged half-life of insulin. Thus, patients with type 1 diabetes receiving insulin who had significant creatinine elevations (mean, 2.2 mg/dL) had a 5-fold increase in the frequency of severe hypoglycemia.143, 144 Therefore, it is imperative that patients being treated intensively monitor their glucose levels closely and reduce doses of medicines (insulin and oral agents) as needed to avoid hypoglycemia.
With progressive decreases in kidney function, decreased clearances of the sulfonylureas or their active metabolites also have been found,385-387 necessitating a decrease in drug dosing to avoid hypoglycemia. Table 22 provides recommendations for dosing of drugs used to treat hyperglycemia in patients with CKD stages 3 to 5. First-generation sulfonylureas (eg, chlorpropamide, tolazamide, and tolbutamide) generally should be avoided in patients with CKD because these agents rely on the kidney to eliminate both the parent drug and active metabolites, resulting in increased half-lives and risk of hypoglycemia. Of the second-generation sulfonylureas (eg, glipizide, gliclazide, glyburide, and glimepiride), glipizide and gliclazide are preferred agents because they do not have active metabolites and do not increase the risk of hypoglycemia in patients with CKD. In the meglitinide class, nateglinide has increased active metabolites with decreased kidney function,388,389 but increased active metabolites do not occur with repaglinide, another meglitinide.390 Metformin should not be given to patients with serum creatinine concentrations of 1.5 mg/dL or greater in men and 1.4 mg/dL or greater in women because it is cleared by the kidney and may build up with even modest impairment of kidney function, putting patients at risk of lactic acidosis.391 However, hypoglycemia is not a problem with metformin. Rosiglitazone is cleared by the liver and does not have to be reduced with impaired kidney function.392 Therefore, rosiglitazone does not increase the risk of hypoglycemia in patients with CKD, but it has the potential, along with pioglitazone, to worsen fluid retention.
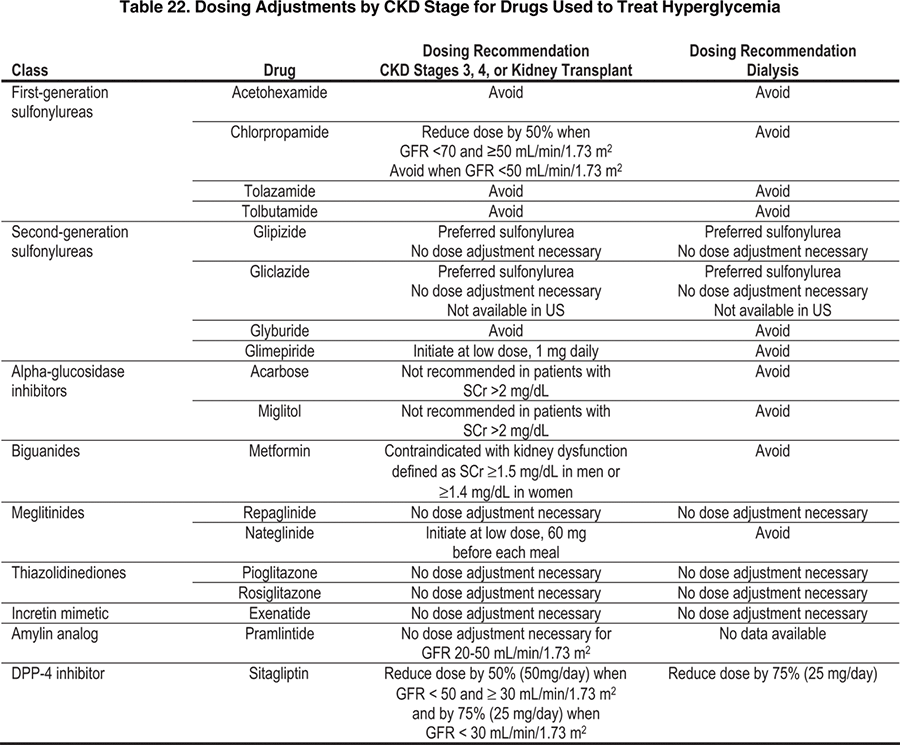
Table 23 lists the available insulin preparations that may be used in diabetes and CKD. Doses are not specified by level of kidney function, but should be adjusted based on frequent monitoring to balance goals of glycemic control with avoiding hypoglycemia. Other considerations that are not specific to the level of kidney function include avoiding or minimizing the occurrence of interactions with drugs used to lower blood glucose. Table 24 lists clinically relevant drug interactions. Other potential drug interactions also may exist.
Table 23. Insulin Preparations Categorized by Duration of Effect

Table 24. Clinically Relevant Interactions With Drugs Used to Treat Hyperglycemia

Assessment of Glycemic Control and Complications Other Than Kidney Disease
An additional factor that may hinder good glycemic control in patients with progressive kidney disease is some degree of inaccuracy of the HbA1c measurement in reflecting ambient glucose concentrations. Factors that may contribute to falsely decreased values include a reduced red blood cell lifespan, hemolysis, and iron deficiency, whereas falsely increased values may occur due to carbamylation of the hemoglobin and acidosis. However, the relationship between HbA1c and glucose concentrations was not different between patients with normal kidney function and those with kidney failure (mean creatinine, 6.6 mg/dL), but some hemodialysis patients had lower than expected HbA1c concentrations relative to the ambient glucose concentrations.393 Opposite findings for dialysis patients were reported.394 In a comparison of different affinity high-performance liquid chromatography methods, the Variant II (Bio-Rad Laboratories) method showed a positive bias (0.59% at 6% HbA1c and 0.88% at 9% HbA1c), but other methods (Primus CLC330, Diamat, Unimate) did not show clinically significant biases (www.missouri.edu/~diabetes/ngsp/index.html; last accessed October 8, 2006).391 Neither peritoneal dialysis nor hemodialysis acutely change HbA1c levels.392 Fructosamine generally correlated more poorly with glucose than did HbA1c in patients with CKD stages 4 and 5.395,396
The patient on long-term dialysis therapy no longer needs to achieve good glycemic control to prevent deterioration of kidney function. However, good control may still prevent or slow the progression of retinopathy, neuropathy, and possibly macrovascular disease. Survival improves with better glycemic control in patients on peritoneal dialysis145 and hemodialysis therapy.146 In the latter study, after adjustment for age and sex, HbA1c was a significant predictor of survival (hazard ratio [HR], 1.133 per 1.0% increment of HbA1c; 95% CI, 1.028 to 1.249; P = 0.012).146
Table 25. ADA Standards for Assessment of Glycemic Control34

Table 26. ADA Standards for Assessment of Retinopathy and Foot Care379
In the opinion of the Work Group, assessment of glycemic control in diabetes and CKD should follow the standards set by the ADA (Table 25).34 In people receiving multiple insulin injections, SMBG is recommended 3 or more times daily (before meals and at bedtime). In those receiving less frequent insulin injections, oral agents, or medical nutrition therapy alone, SMBG is useful in achieving glycemic goals. Postprandial SMBG testing also may be helpful, particularly in patients with gastroparesis, to achieve postprandial glucose goals and in patients using rapid insulin injections before meals to adjust the dose-meal calculation. The optimal frequency of SMBG has not been established in patients with type 2 diabetes treated by oral agents, but the ADA recommends testing sufficiently often to reach glycemic goals. In addition, HbA1c levels should be determined at least twice per year in stable patients who are achieving glycemic goals and more often, approximately every 3 months, in patients whose therapy has changed or who are not reaching goals.
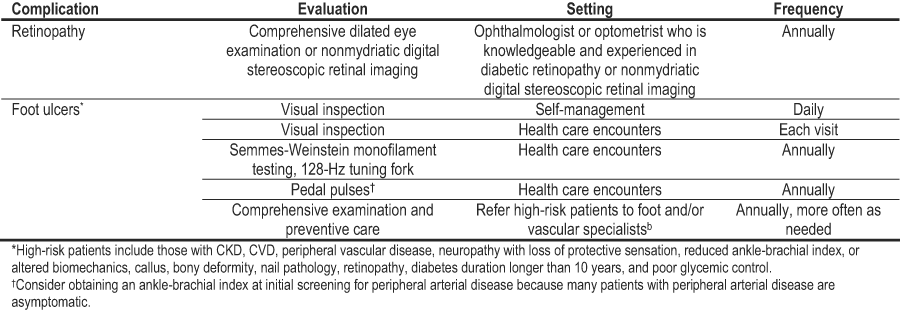
Other microvascular and macrovascular complications of diabetes are common in those with CKD. Assessment and management of CVD is addressed in the Background section of these guidelines. Screening and treatment of retinopathy and foot care also are essential to the care of patients with diabetes and kidney disease. In the absence of specific data in the diabetes and CKD population, the Work Group recommends following the standards set by the ADA (Table 26).34 An ophthalmologist or optometrist who is knowledgeable and experienced in the diagnosis and management of diabetic retinopathy should perform a comprehensive dilated eye examination annually in all people with diabetes. Recently, nonmydriatic digital stereoscopic retinal imaging has proved to be a sensitive and specific method to screen and diagnose retinopathy, and it is being used in many facilities. In a recent study, sensitivity was 98% and specificity was 100%.397 Patients should be educated about the importance of foot surveillance and ulcer prevention, with an emphasis on self-management as discussed in CPR 4. The feet should be examined visually at each health care visit. A comprehensive foot and vascular examination including visual inspection, Semmes-Weinstein monofilament testing, use of a 128-Hz tuning fork for testing of vibratory sensation, and evaluation of pedal pulses should be performed annually. Because the risk of ulcers and amputations is high in those with diabetes and CKD, referral to foot-care specialists for annual examinations and preventive care is encouraged.