AIMS
THE OVERALL AIMS of the project were to develop a set of clinical practice guidelines that would improve diagnoses and treatment of bone disease in CKD and serve as a clinical action plan for the health care practitioner.
Fundamental to this effort was the development of an evidence base upon which the guidelines are founded. This base was derived through a systematic summary of the available scientific literature on the clinical assessment and treatment of bone disease and derangement in mineral metabolism in CKD, and the inter-relationship of disorders of mineral and bone with the various stages of CKD.
Two products resulted from this process: (a) an evidence report which consists of the summary of the literature (portions of the evidence report are contained in this document; the entire evidence report remains on file with the National Kidney Foundation) and (b) a set of clinical practice guidelines regarding the clinical action plan which are contained in this report.
ASSIGNMENT OF DOMAINS
The Co-Chairs of the KDOQI Advisory Board selected the Work Group Chair and Vice Chair, who selected the Work Group and assigned "domain experts" to be responsible for the development of guideline statements in different areas. These were individuals from North America with expertise in nephrology, pediatrics, laboratory medicine, bone disease, and nutrition. ECRI was selected by the National Kidney Foundation as the Evidence Review Team that would review and analyze the published evidence and produce an evidence report, collaborating integrally with the Work Group. The Evidence Review Team and the Work Group collaborated closely throughout the project.
OVERVIEW OF PROCESS
Three Work Group meetings and a series of conference calls were carried out to develop an evidence model, assess the literature, evaluate the evidence base, review the evidence report, and draft guideline statements. Prior to the development of the evidence base, a set of hypothetical guideline statements (leaving a blank where values from the evidence were to be inserted following development of the final evidence report) were developed by the Work Group in order to define the parameters of the literature review. This evidence base consisted of an evidence report prepared by the Evidence Review Team that included 26 meta-analyses of the available scientific literature and numerous summaries of data.
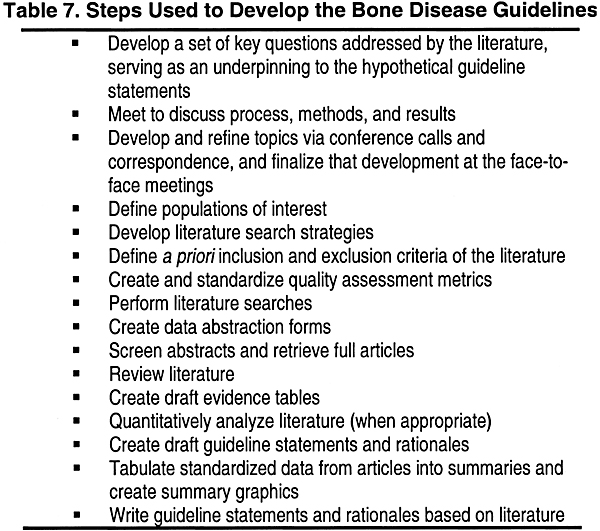
The steps used to develop the guidelines and evidence base are listed in Table 7.
Final voting was used to arrive at a Work Group consensus on final guideline statements and supporting rationale, graded according the level of evidence on which it was based. The overall guidelines were then graded according to the strength of evidence supporting the line of logic of the rationale statements.
DEVELOPMENT OF TOPICS
The goals of the Work Group spanned a diverse group of topics. The Work Group Chair and Vice Chair initially formulated a working list of "key questions" that should be addressed in the evidence report and then converted into hypothetical guideline statements. At an initial Work Group meeting in April 2000, these questions and resulting statements were refined through discussions between the Work Group and the Evidence Review Team. Work Group members were given two additional opportunities to refine the key questions, which were finalized in May 2000. Each key question typically had several outcomes of interest, from long-term, patient-oriented outcomes such as quality of life and mortality, to short-term intermediate outcomes such as serum calcium and phosphate levels. The key questions were divided into 9 sections:
Hypothetical guideline statements were then prepared from the key questions, and these statements were used to formulate and refine the final guideline statements. The Work Group voted on the final wording of each guideline statement in relationship to the final evidence report presented. As the hypothetical guideline statements were formulated, these questions were redivided into 16 different Guideline areas corresponding to the guidelines set forth in this document.
LITERATURE SEARCHES
The Work Group and Evidence Review Team agreed on a systematic process to be followed to review literature pertaining to the key questions and hypothetical guideline statements. Based on these key questions, information specialists at the Evidence Review Team performed database literature searches to identify the relevant published medical literature to address the key questions. A list of terms pertaining to specific kidney and bone diseases was forwarded to the Work Group members for review. Terms were excluded from the strategies only if all members of the Work Group agreed that they were not essential. The strategies were modified following the first Work Group meeting in April 2000, and were further modified following the second meeting in July 2000. Major databases searched included: Medline, Embase, PsychLit, Cochrane Library, and CINAHL. In total, 10 major databases were searched.
ARTICLE RETRIEVAL CRITERIA
A priori criteria were established for determining whether an article identified by the literature searches should be retrieved before the searches were performed to reduce the possibility of bias in selecting articles. The criteria served to establish minimum standards of relevance and quality of the retrieved articles. The agreed-upon inclusion criteria were:
ARTICLE RETRIEVAL METHODOLOGY
Abstracts of each article identified in the electronic searches were downloaded into the Evidence Review Team’s database. These abstracts were then reviewed by research analysts trained in the assessment and analysis of medical data. Articles were requested if they appeared to meet the criteria outlined above. If there was any uncertainty as to whether an article met the criteria, the article was requested.
ARTICLE INCLUSION CRITERIA
The resulting articles were then evaluated to determine whether they met criteria for inclusion in this evidence report. There were both general and question-specific inclusion criteria, in order to include only the most appropriate and highest-quality evidence. Studies were included only if:
In the consideration of any treatment-related question, the following hierarchy, an adaptation of that proposed by the US Preventative Health Task Force, was used to identify the highest quality studies:
Highest quality
Low quality
RETRIEVAL AND INCLUSION OF PUBLISHED TRIALS
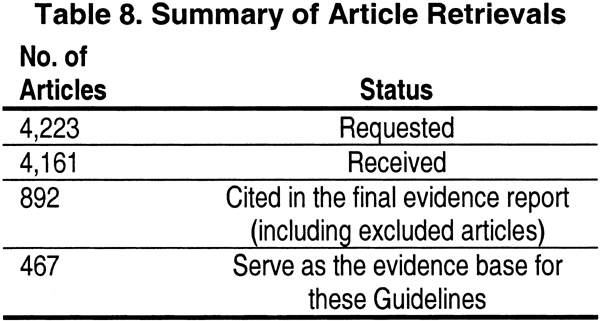
There were 22,353 citations identified for this project through electronic and hand searches. Some of these citations represent entire database searches rather than a single document. Any studies deemed relevant to the topic were retrieved. Article retrieval requests made for this project are summarized in Table 8.
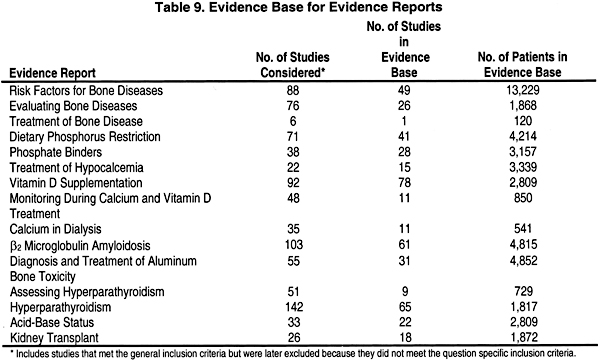
Table 9 outlines the number of studies included in each of the 15 evidence reports, as well as the number of patients represented by these studies.
Format for Evidence Tables
Five types of evidence tables were prepared during the course of this project and were included in the Evidence Reports prepared by the Evidence Review Team.
Detailed tables contain data from each field of the components of the data abstraction forms. These tables were initially distributed to the Work Group in September 2000, so that they could evaluate the evidence and determine whether any important articles were missed or inappropriate articles were included. These tables are contained in the Appendix of each Evidence Report.
In-text study detail tables summarized the most salient aspects of study design, in particular those aspects that were used to determine the methodology quality rating. These tables were constructed for each key question and included in the body of each evidence report.
In-text patient characteristics tables summarized the most salient aspects of the patients included in each study. The tables were produced for each key question. In particular, these tables pointed out the number of patients, number of women, number of patients with diabetes, number of children, and mean age of the patients (with standard deviation), among other characteristics.
In-text evidence tables were produced for each outcome measure within each key question. The evidence tables reported the evidence as it was used by the Evidence Review Team to perform quantitative analyses, not the evidence as it was reported by the authors of a study. Whenever possible, the results from each study were recalculated and standardized into a common, metric, Hedges’ d. This is a standardized metric that converts results comparing 2 independent groups into standard deviation units. In this way, results from different studies that were reported in different metrics could be combined for analysis. P values were not reported in these tables, as they are strongly affected by the study size and therefore can be misleading about the true size of the effect found.
Study Quality Overview tables, also included in the body of the evidence reports, were produced for those key questions that addressed a treatment issue for which controlled trials were available. The rating scheme used was applied only to controlled trials. No rating scheme was developed for diagnostic studies, as there is no widely accepted hierarchy of evidence in the technology assessment community. These tables described the strength of evidence according to 3 dimensions: size of the study, applicability, and methodological quality.
Rating Scheme to Evaluate the Quality of Controlled Trials
Rating schemes are an essential part of the clinical guideline development process. To the reader of a guideline, the use of these rating scales provides an easy indicator of the quality of the evidence on which the guideline was formulated. As a result, any clinician reading the guideline knows how confidently to believe the recommendations of the guideline.
The rating scheme used in this evidence report is multidimensional and takes into account the following study attributes:
The exact rating method used for each of these dimensions is outlined briefly below.
Study Design and Methodology
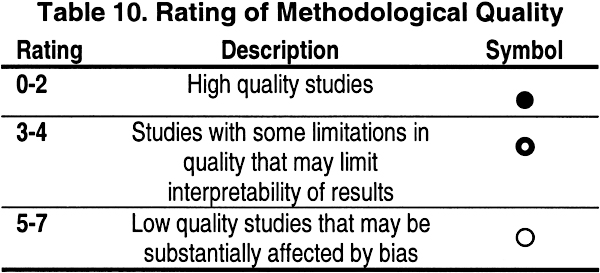
The quality of the study design, or "internal validity" was the focal point of the rating scale. The methodology of a single study was rated using a 0 to 7 scale as shown in Table 10.
This 0 to 7 rating scale was developed by extracting the following data from each study, and assigning various point values:
All points were then added together for a final score in the range of 0 to 7. The final score was represented using the graphics shown above in the Overview of Study Quality table included for each key question answered in the evidence reports.
Patient Applicability
Patient applicability refers to whether a patient group included in any given trial is relevant to the issue being addressed. This is a measure of external validity or generalizability of a study’s results.
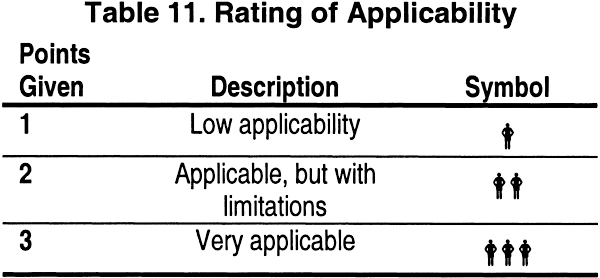
The rating of patient applicability was done on a 3 point scale as shown in Table 11.
The entries on patient applicability for each study required the input of the Work Group. They were instructed to enter the point rating for each study as they reviewed draft copies of the evidence reports for these Guidelines, produced by the Evidence Review Team.
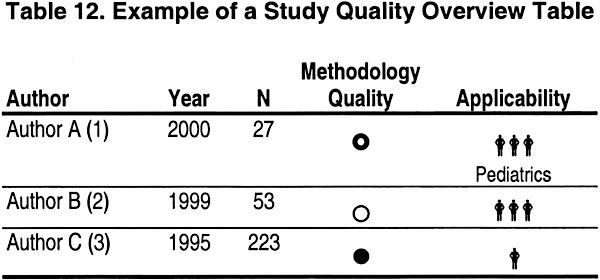
An example of the quality overview of a study is shown in Table 12. A filled-in circle represents the highest quality and an empty circle the lowest quality. Applicability indicates whether the patients included in this study were appropriate for answering the question; 3 figures is most appropriate, while 1 figure is least appropriate. (Adults and children were indicated separately, as shown.) We stress that rating systems such as this are highly subjective.
Reporting of Results
The results for most controlled and pre-/post-treatment trials were reported in terms of Hedges’ d, a standardized effect size. Because Hedges’ d is in standard deviation units, its value generally can range from -3 to +3. Thus, the graphical representation used was as follows:

If Hedges’ d could not be calculated for a particular study (because not enough information was available), the reported study results were tabled instead, and the above graphics were used to represent whether the results were statistically significant or not (as indicated by the P value reported by the study).
Quantitative Analysis of Studies
To analyze diagnostic trials, ECRI used a method called the "summary receiver operating characteristics (ROC) curve." This is the most widely accepted analytical method for combining results from different diagnostic trials. It combines and plots the sensitivity (true positive rate) against speci<zhy;eb;n;j>ficity (inverse of the false positive rate) of a particular diagnostic test from several trials. The summary ROC includes 95% confidence intervals for complete evaluation of the statistical significance of the efficacy of the test compared to flipping a coin (chance). In this way, all the available evidence about a test’s tradeoffs between false positives and false negatives can be considered.
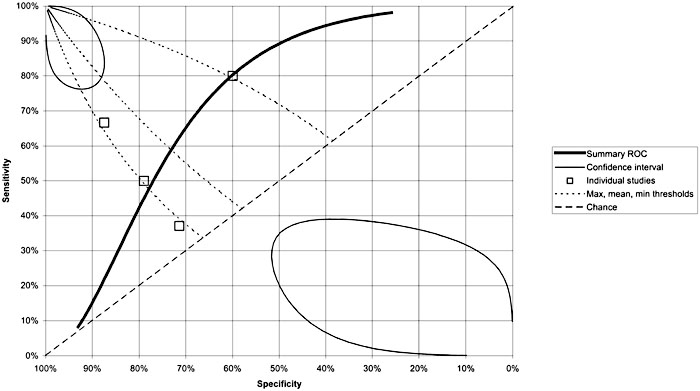
Fig 3. Example of Summary ROC analysis.
In ROC space, sensitivity is plotted against specificity. The more effective the diagnostic test, the closer it falls to the upper left corner of the grid (sensitivity and specificity 100%). The summary ROC curve (Fig 3) represents a diagnostic meta-analysis, combining the results from all 4 studies on X-ray erosions. This curve reflects the necessary tradeoff between sensitivity (1 - false negative rate) and specificity (1 - false positive rate) inherent in any diagnostic test. By changing the diagnostic threshold between results called positive and results called negative, the test can theoretically operate at any point along the ROC curve. The summary ROC is superior to averaging study results for meta-analysis of diagnostic test results because averaging systematically underestimates sensitivity and specificity.
The mean threshold point is the best single point estimate of the sensitivity and specificity of the diagnostic test in question. The 95% confidence intervals (CIs) for the ROC curve are also important to consider. If the lower 95% CI line were to fall below the chance line (a 45° line), it would suggest that the diagnostic test does not have a statistically significantly probability greater than chance of detecting the disease.
Voting Procedures on Final Guideline Statements
The following voting method was used:
A tally was taken to determine whether consensus among Work Group members exists for each Guideline statement. Consensus among Work Group members was defined by at least a 75% majority approval of a Guideline statement (eg, with 12 Work Group members present, a vote of 9 was necessary to consider the statement approved). Guidelines that did not receive approval were re-drafted and re-submitted to Work Group members for final voting.
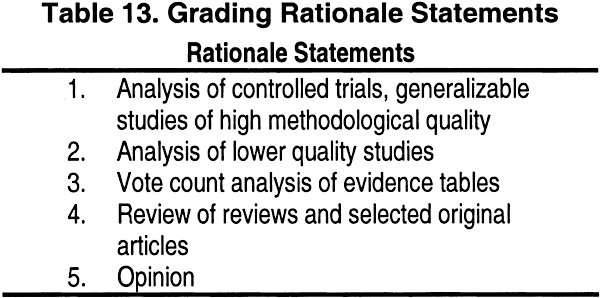
Each rationale statement has been graded according to the level of evidence on which it is based (Table 13). The overall guideline is then graded according to the strength of evidence supporting the rationale statements.