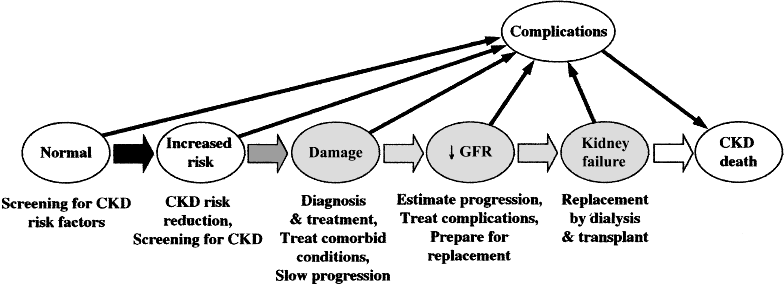
| Figure 1 | Evidence Model for Stages in the Initiation and Progression of Chronic Kidney Disease and Therapeutic Interventions |
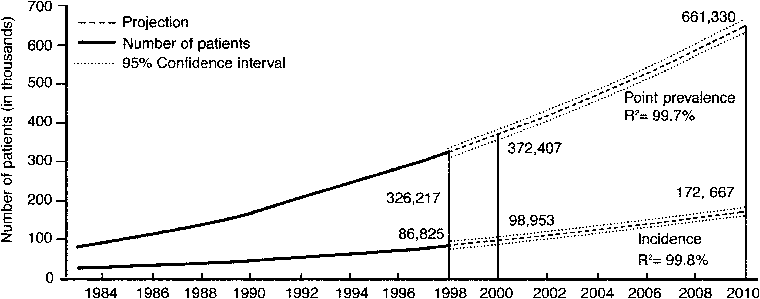
| Figure 2 | Incidence and Prevalence of End-Stage Renal Disease in the US |
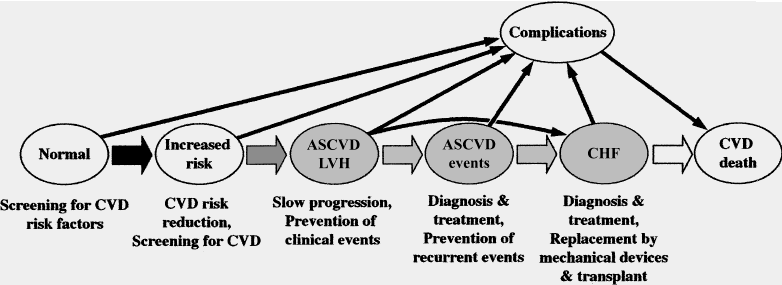
| Figure 3 | Evidence Model for Stages in the Initiation and Progression of Cardiovascular Disease and Therapeutic Interventions |
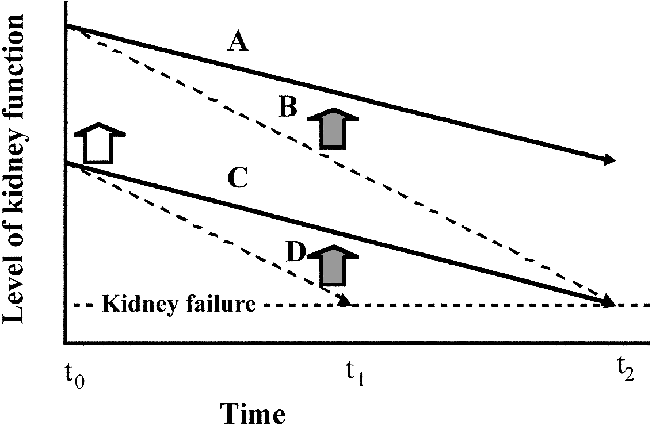
| Figure 4 | Kidney Function Decline in Chronic Kidney Disease |
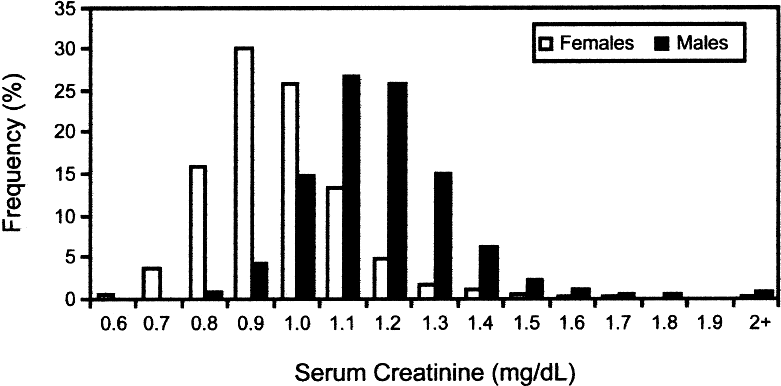
| Figure 5 | Creatinine Distribution: US Population Age ≥20 by Sex |
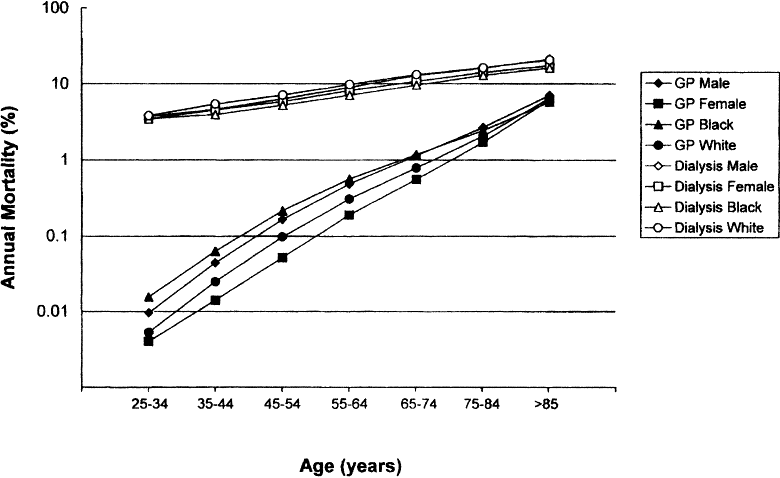
| Figure 6 | Cardiovascular Mortality in the General Population (NCHS) and in ESRD Treated by Dialysis (USRDS) |
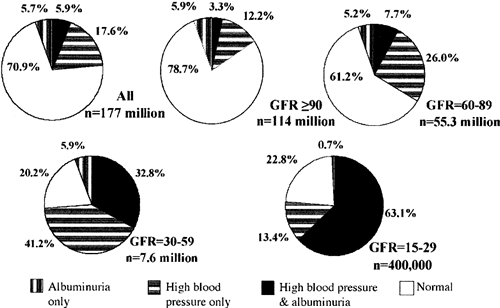
| Figure 7 | Prevalence of Albuminuria and High Blood Pressure (%) in US Adults Age ≥20 Years, NHANES III, 1988-1994 |
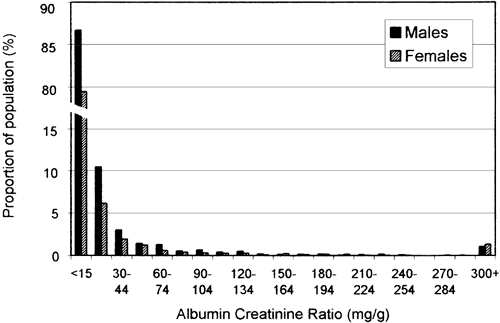
| Figure 8 | Distribution of Albumin-to-Creatinine Ratio in US Men and Women, Age ≥20 Years: NHANES III, 1988-1994 |
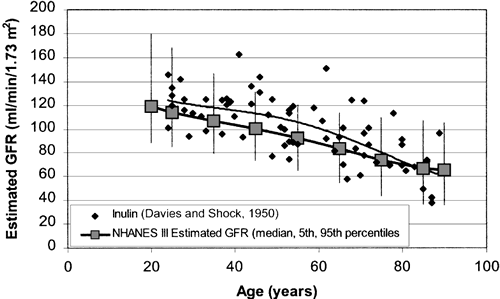
| Figure 9 | GFR vs. Age |
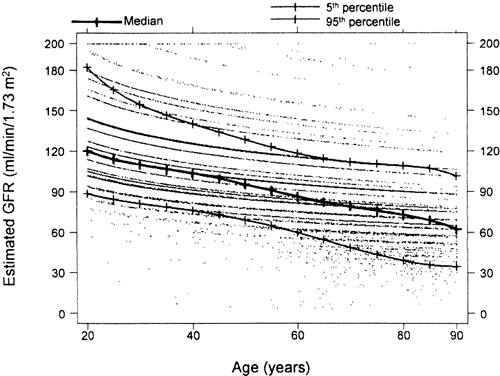
| Figure 10 | Percentiles of GFR Regressed on Age (NHANES III) |
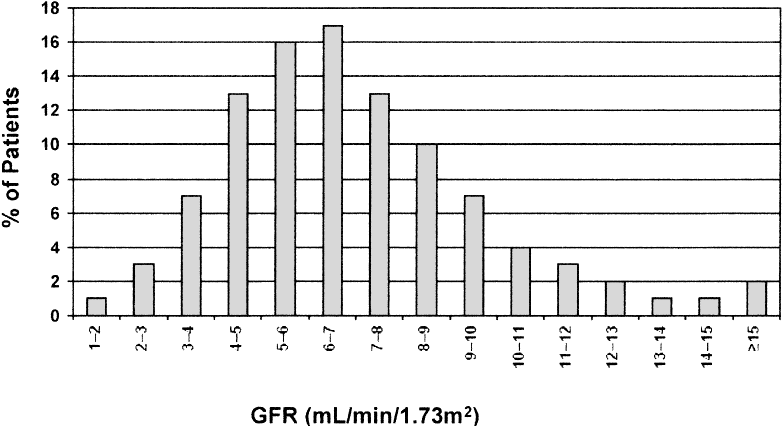
| Figure 11 | Level of GFR at Initiation of Replacement Therapy (USRDS) |
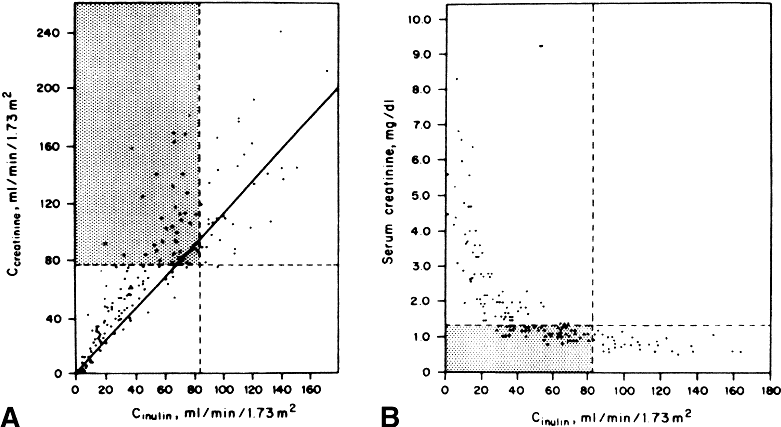
| Figure 12 | Relationship of Creatinine Clearance and Serum Creatinine With GFR (Inulin Clearance) in Patients With Glomerular Disease |
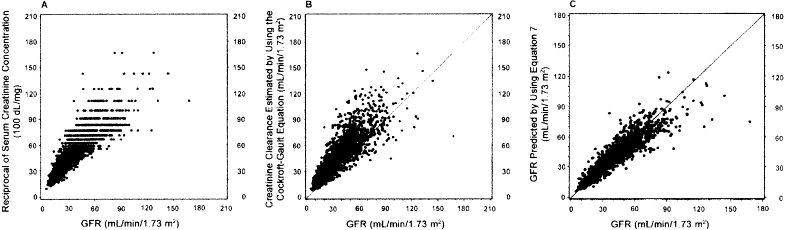
| Figure 13 | Estimates of GFR vs. Measured GFR Among MDRD Study Baseline Cohort |
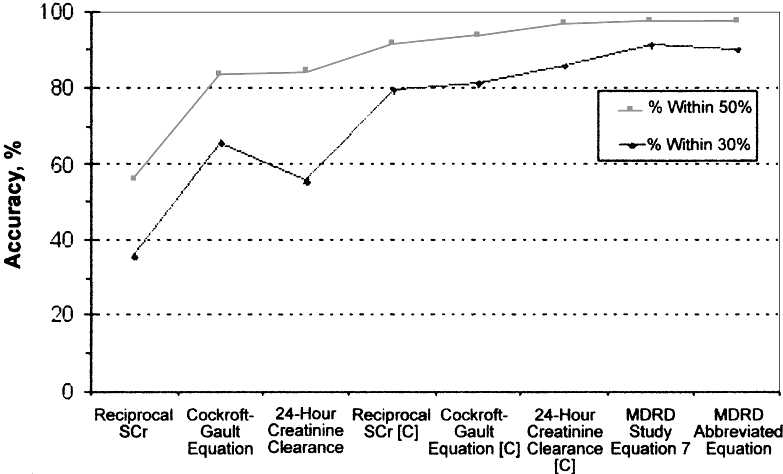
| Figure 14 | Accuracy of Different Estimates of GFR in AduPrevalence of Patients by Number of Abnormalities by Level of GFR (NHANES III) |
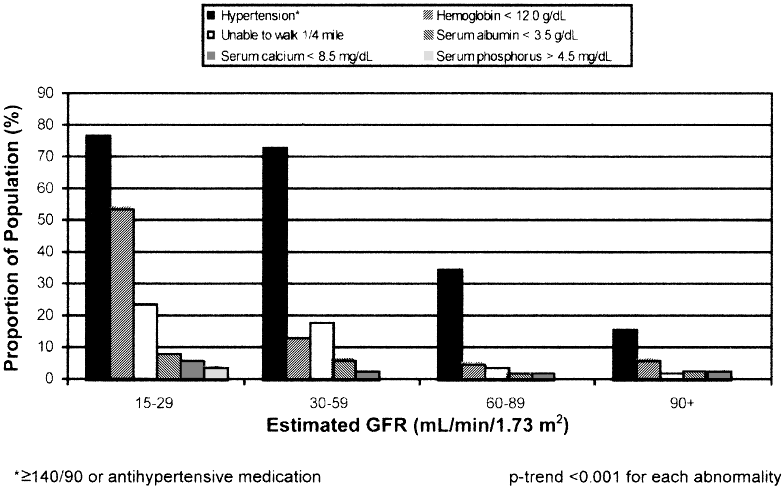
| Figure 15 | Prevalence of Patients by Number of Abnormalities by Level of GFR (NHANES III) |
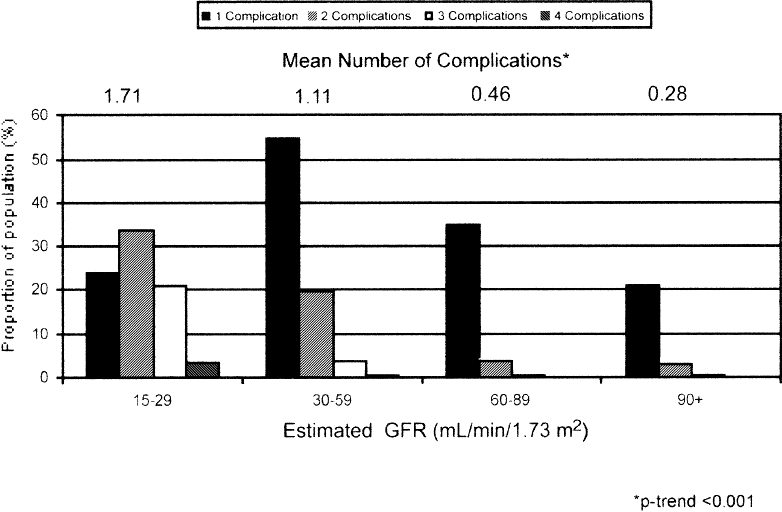
| Figure 16 | Proportion of Patients by Number of Abnormalities by Level of GFR (NHANES III) |
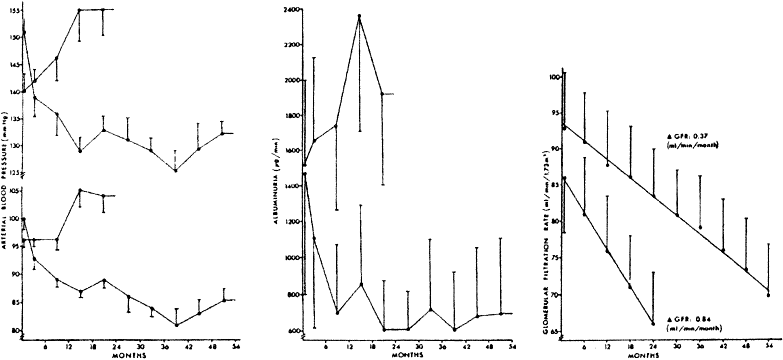
| Figure 17 | Relationship Between Blood Pressure and Progression of Diabetic Kidney Disease |
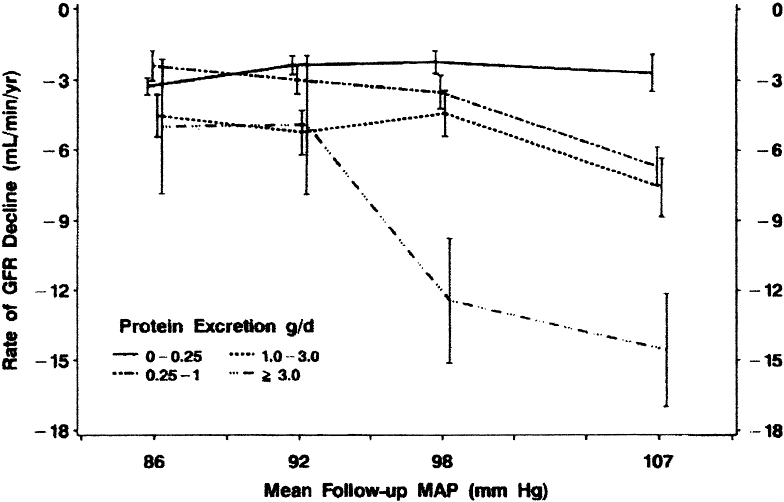
| Figure 18 | Relationship Between Mean Arterial Blood Pressure and GFR Decline |
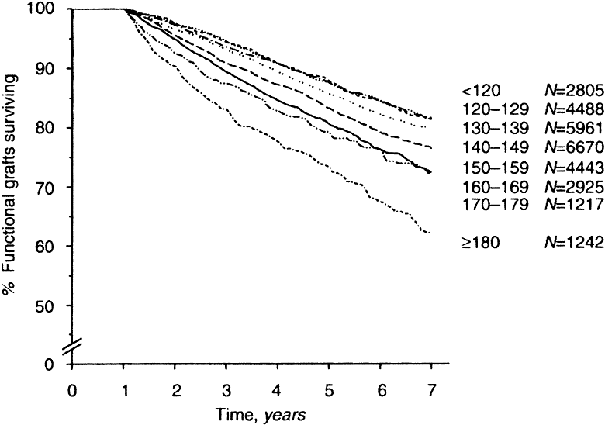
| Figure 19 | Relationship Between Systolic Blood Pressure and Graft Survival |
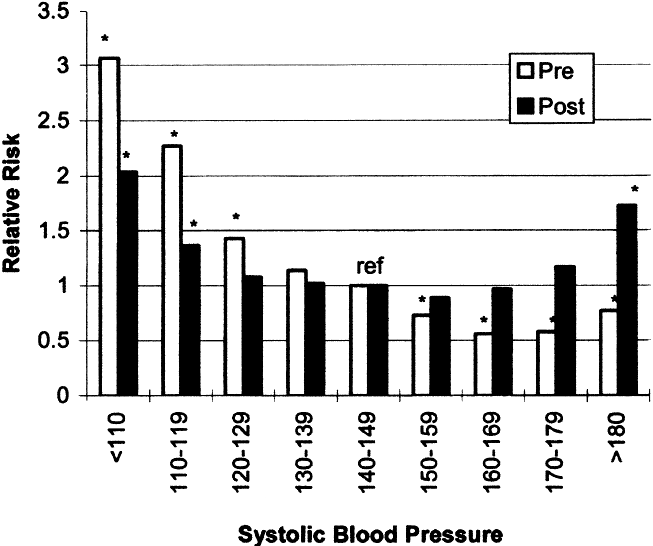
| Figure 20 | Mortality vs. Systolic Blood Pressure in Hemodialysis Patients |
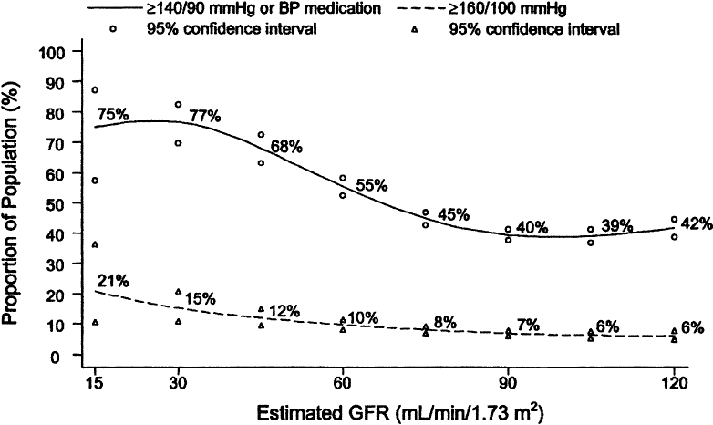
| Figure 21 | Prevalence of High Blood Pressure by Level of GFR in the MDRD Study |
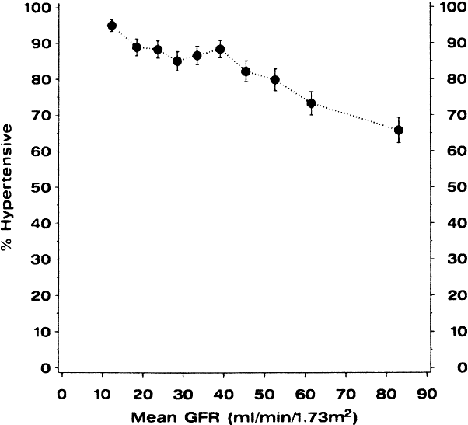
| Figure 22 | Prevalence of High Blood Pressure by Level of GFR, Adjusted to Age 60 Years (NHANES III) |
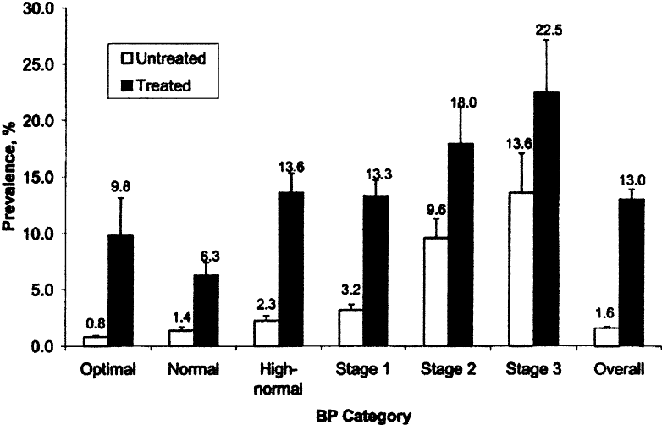
| Figure 23 | Prevalence of Elevated Serum Creatinine by JNC–VI Blood Pressure Category and Self-Reported Treatment With Anti-Hypertensive Medications (NHANES III) |
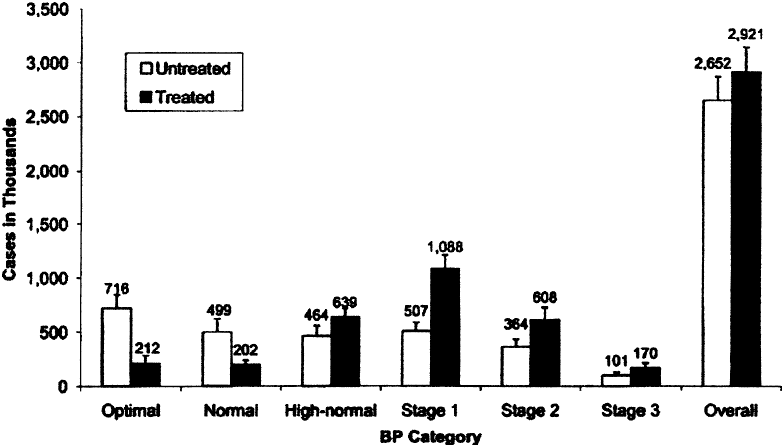
| Figure 24 | Estimated Number of Individuals With Elevated Serum Creatinine by JNC–VI Blood Pressure Category and Self-Reported Treatment With Anti-Hypertensive Medications (NHANES III) |
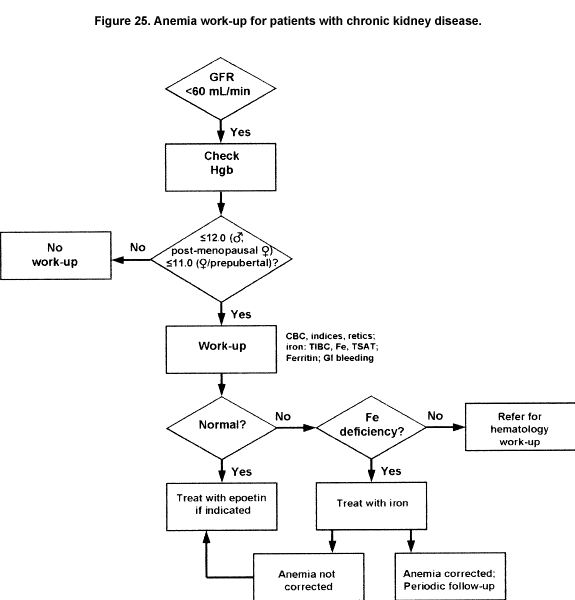
| Figure 25 | Anemia Work-Up for Patients With Chronic Kidney Disease |
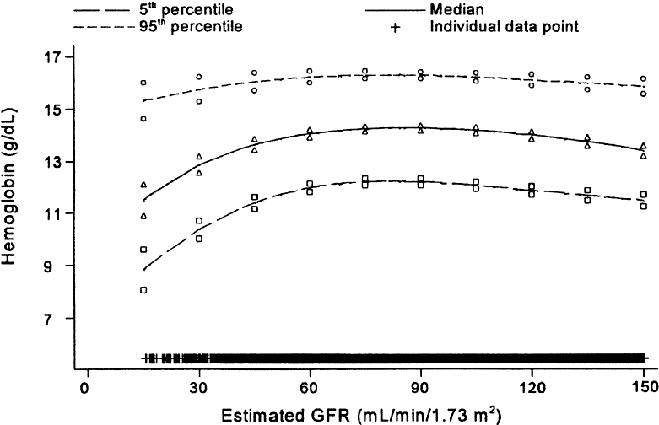
| Figure 26 | Blood Hemoglobin Percentiles by GFR Adjusted to Age 60 (NHANES III) |
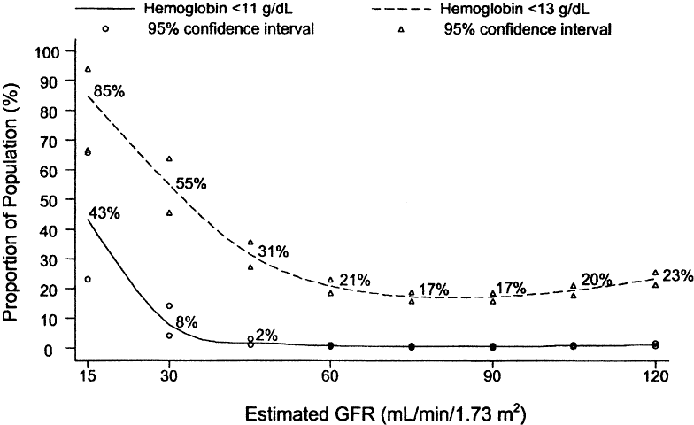
| Figure 27 | Adjusted Prevalence in Adults of Low Hemoglobin by GFR (NHANES III) |
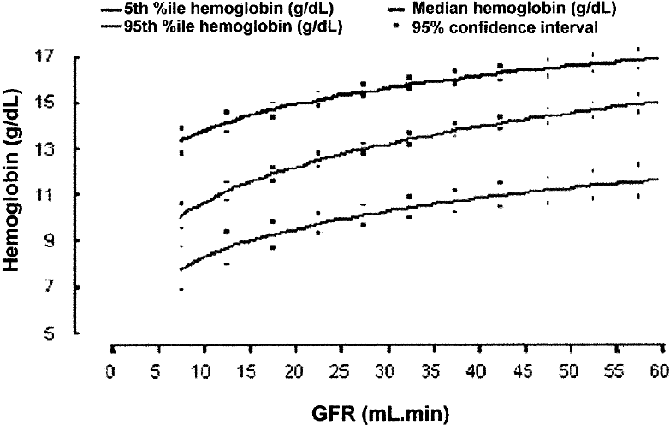
| Figure 28 | Hemoglobin Percentiles by GFR |
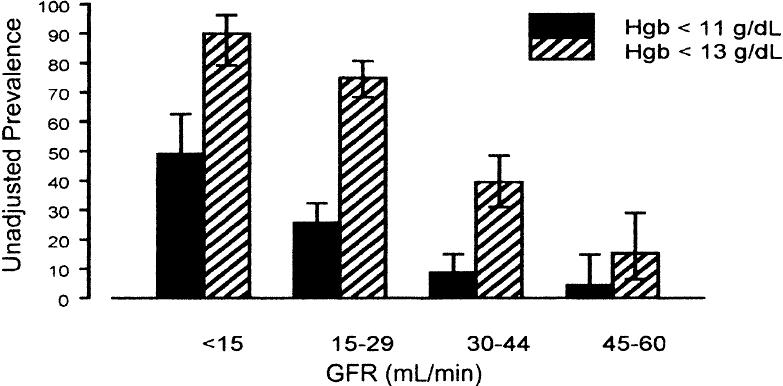
| Figure 29 | Prevalence of Low Hemoglobin by GFR Category |
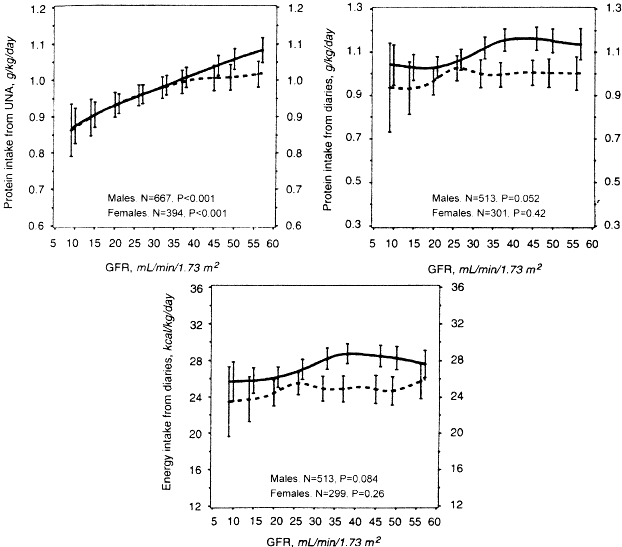
| Figure 30 | Association of Dietary Intake and GFR |
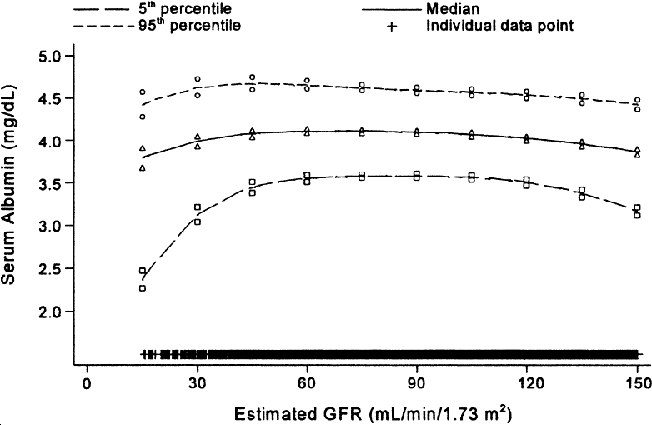
| Figure 31 | Serum Albumin Percentiles by GFR Adjusted to Age |
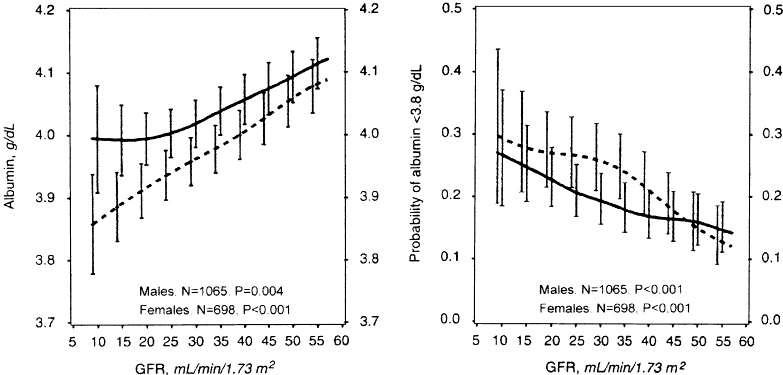
| Figure 32 | Association of Serum Albumin and GFR |
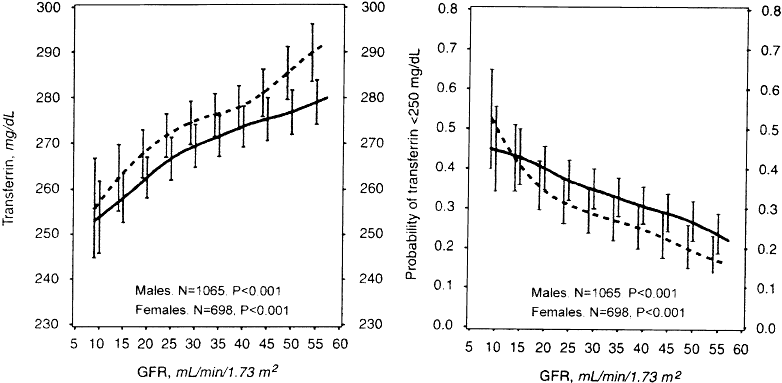
| Figure 33 | Association of Serum Transferrin and GFR |
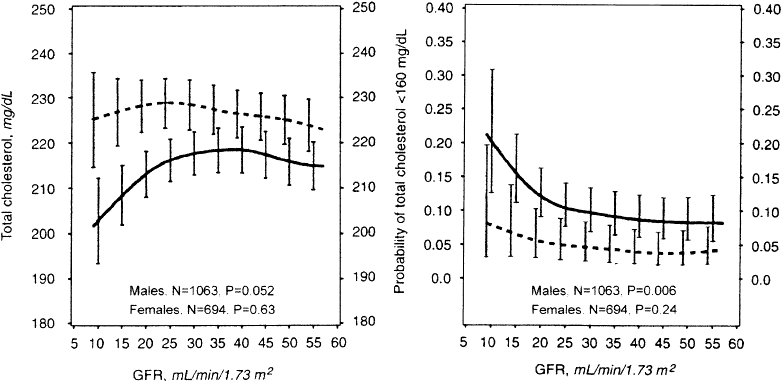
| Figure 34 | Association of Serum Cholesterol and GFR |
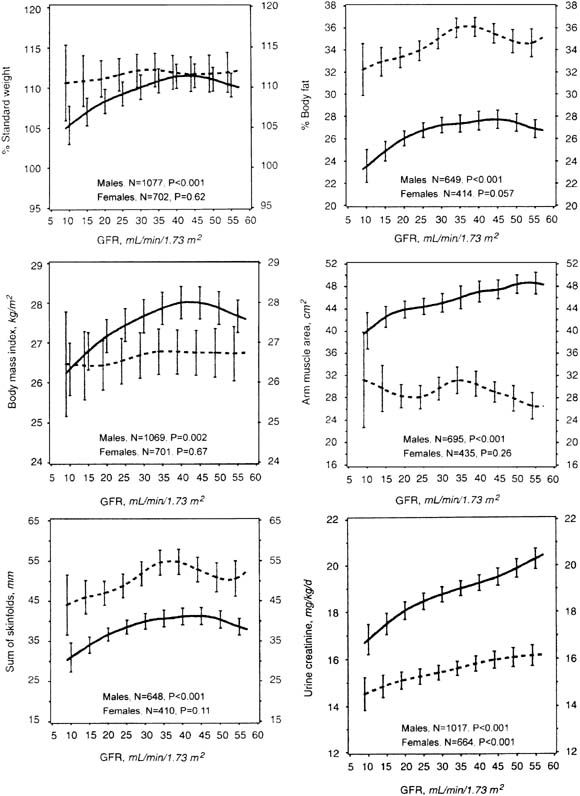
| Figure 35 | Association of Body Composition and GFR |
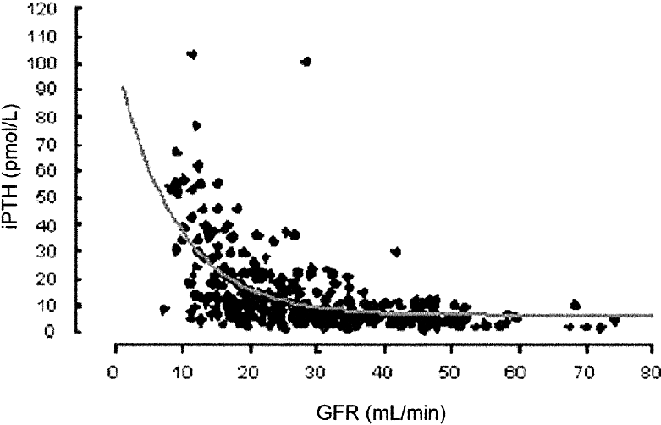
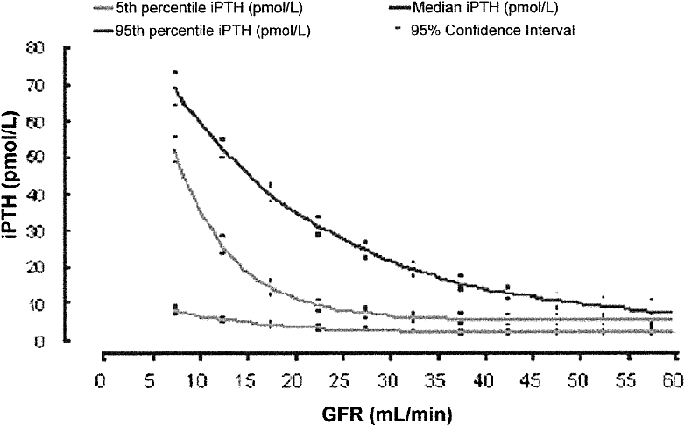
| Figure 36 | Scatterplot of iPTH vs. GFR |
| Figure 37 | iPTH Percentiles by GFR |
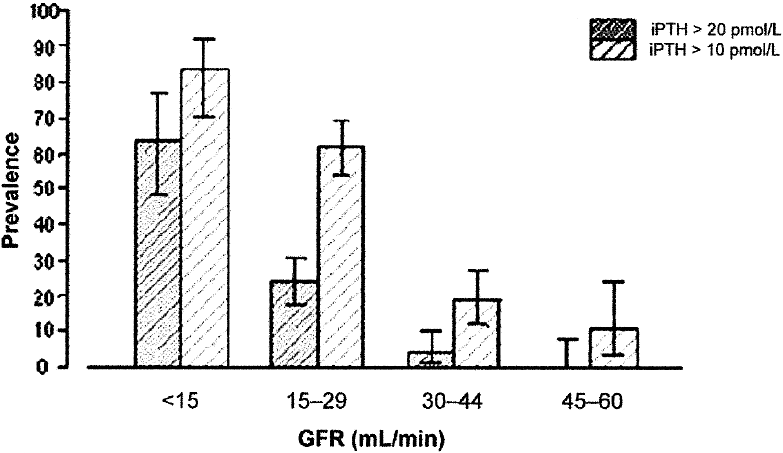
| Figure 38 | Prevalence of High iPTH by GFR Category |
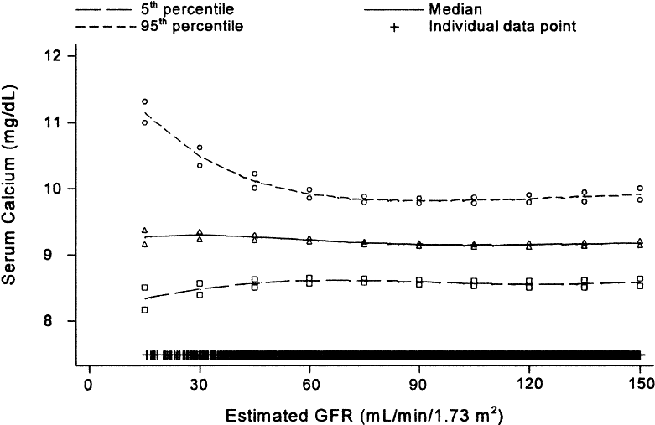
| Figure 39 | Serum Calcium Levels (Adjusted for Albumin) vs. GFR |
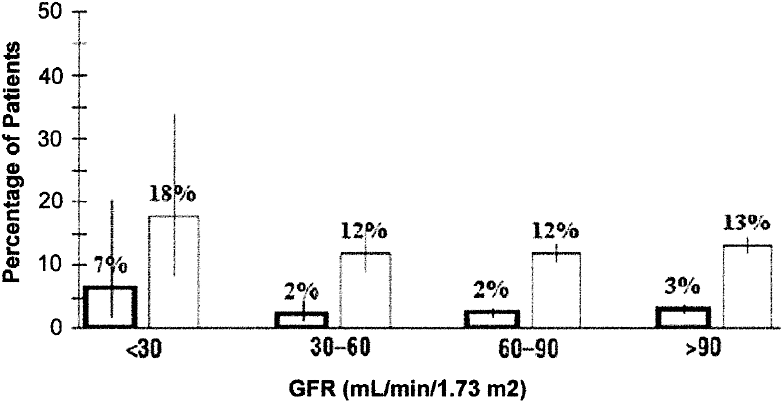
| Figure 40 | Prevalence of Hypocalcemia (Adjusted for Albumin) vs. GFR |
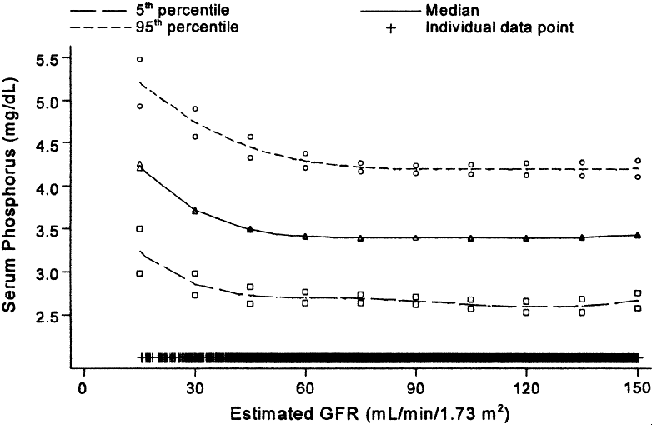
| Figure 41 | Serum Phosphorus Levels vs. GFR (NHANES III) |
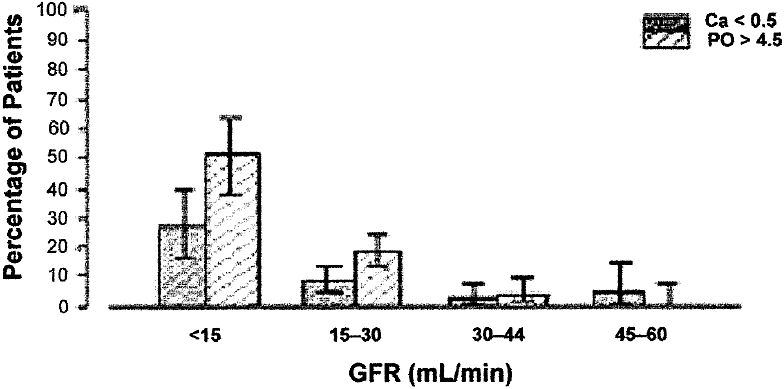
| Figure 42 | Prevalence of Low Calcium and High Phosphate by GFR Category |
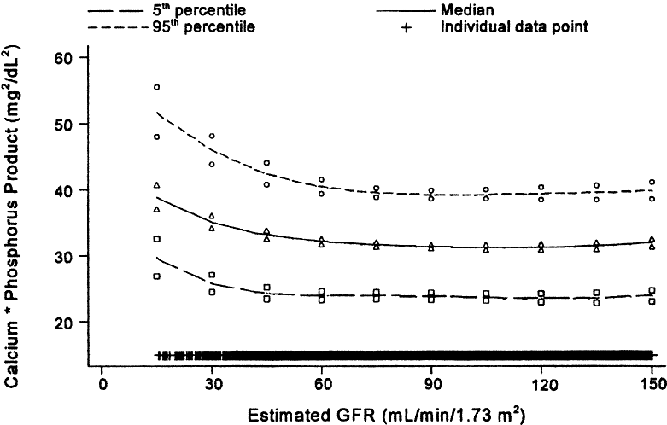
| Figure 43 | Calcium-Phosphorus Product Percentiles by GFR (NHANES III) |
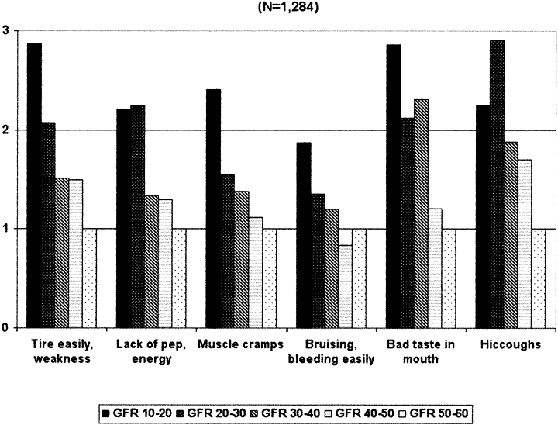
| Figure 44 | Kidney Function (GFR) and Odds of Having Symptoms Affecting Quality of Life and Well-Being |
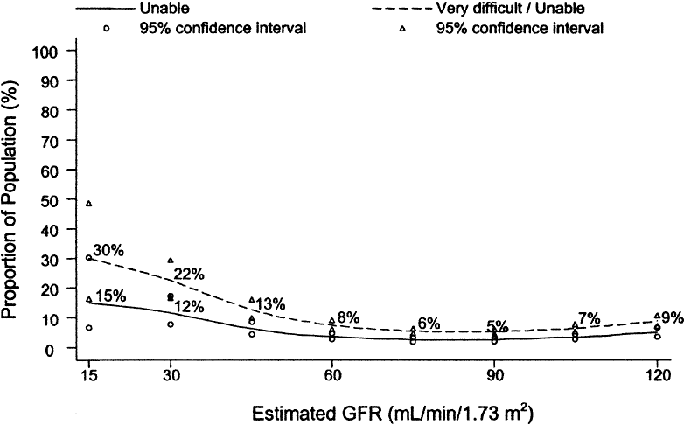
| Figure 45 | Adjusted Prevalence of Physical Inability to Walk by GFR Category (NHANES III) |
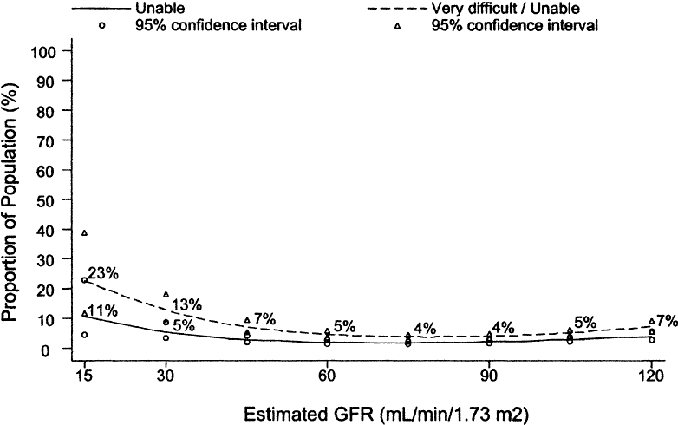
| Figure 46 | Adjusted Prevalence of Physical Inability to Lift by GFR Category (NHANES III) |
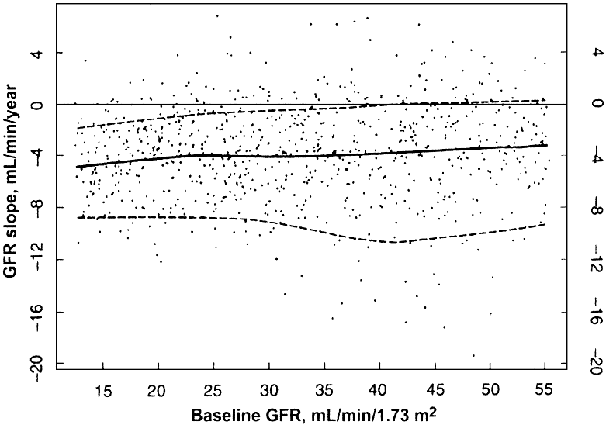
| Figure 47 | GFR Slopes in the Modification of Diet in Renal Disease Study |
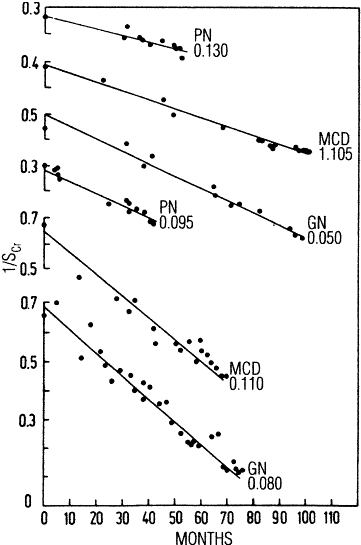
| Figure 48 | Composite Plot of Reciprocal Serum Creatinine vs. Time in Six Patients With Chronic Kidney Disease |
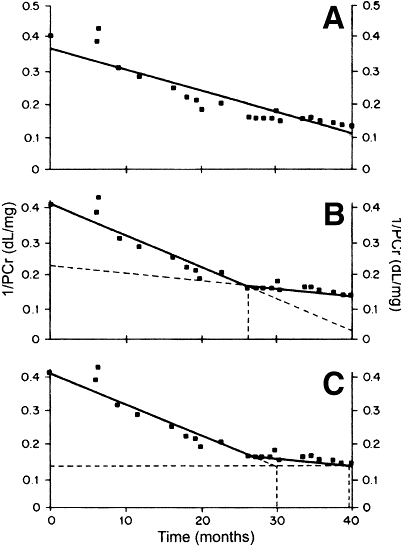
| Figure 49 | Plot of Reciprocal of Plasma Creatinine (1/PCr) in a Patient |
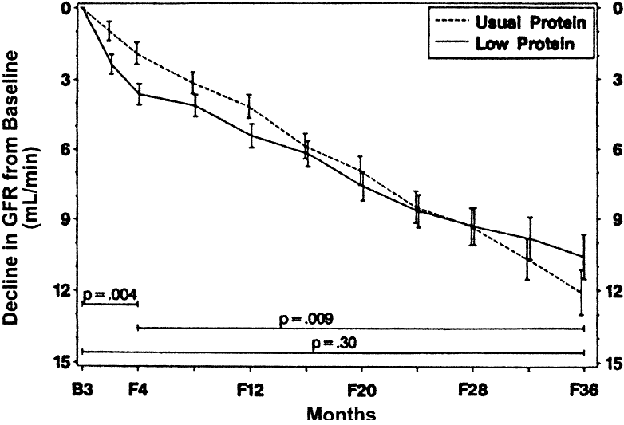
| Figure 50 | Comparison of GFR Decline Between Diet Groups in the Modification of Diet in Renal Disease Study |
| Figure 51 | Cardiovascular Mortality With Diabetes |
| Figure 52 | Microalbuminuria and Cardiovascular Morbidity With Type 2 Diabetes |
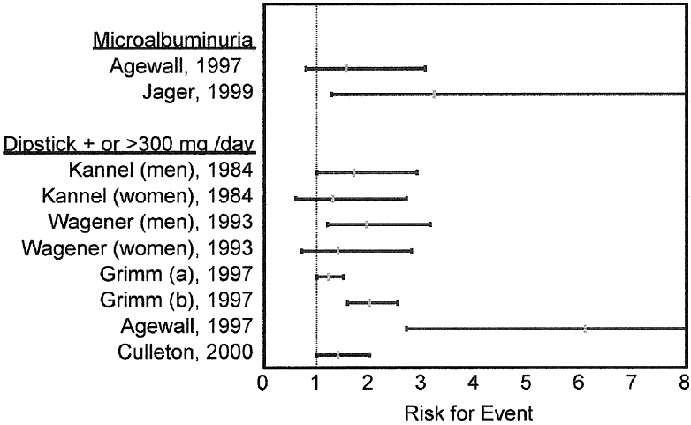
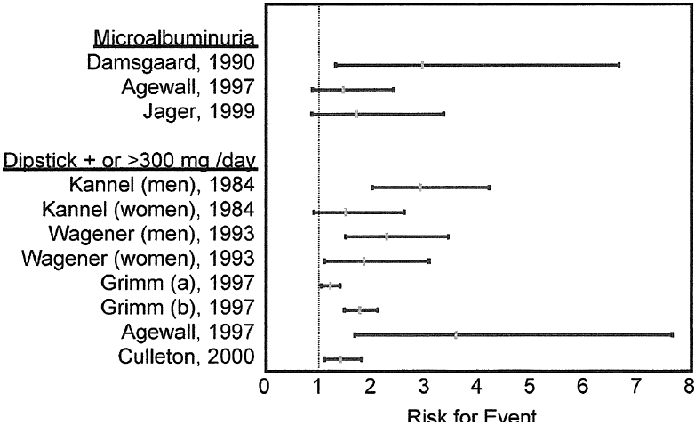
| Figure 53 | GFR and Relative Risk for Death |
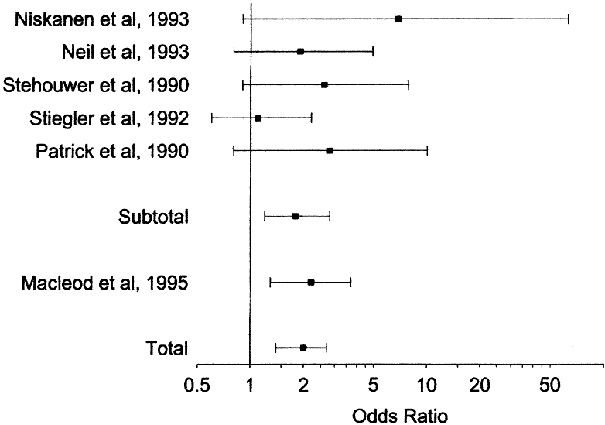
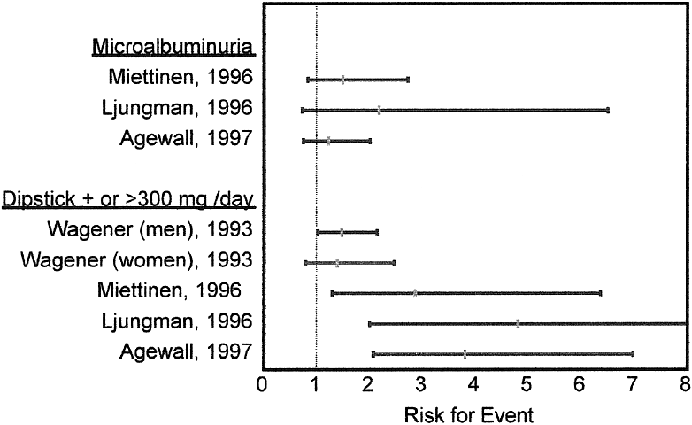
| Figure 54 | Proteinuria and Relative Risk for Cardiovascular Disease |
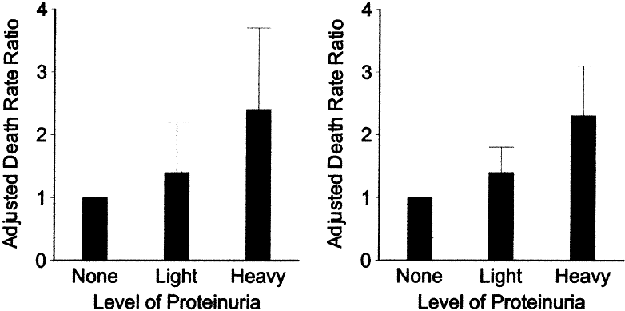
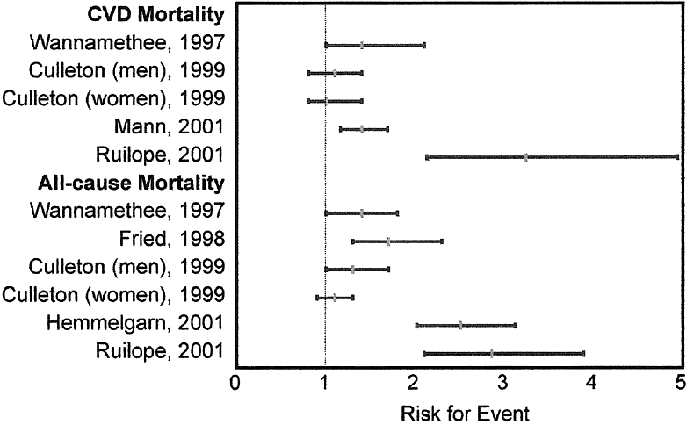
| Figure 55 | Proteinuria and Relative Risk for CVD Death |
| Figure 56 | Proteinuria and Relative Risk for Death |
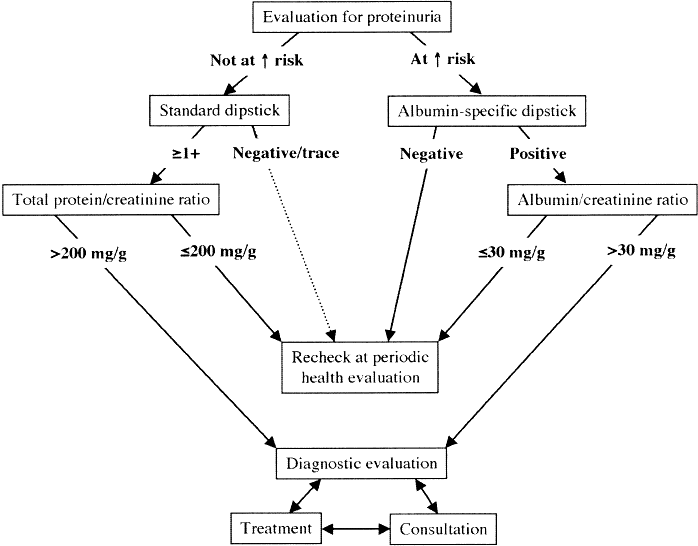
| Figure 57 | Evaluation of Proteinuria in Patients Not Known to Have Kidney Disease |