GUIDELINE 10. ASSOCIATION OF LEVEL OF GFR WITH BONE DISEASE AND DISORDERS OF CALCIUM AND PHOSPHORUS METABOLISM
Bone disease and disorders of calcium and phosphorus metabolism develop during the course of chronic kidney disease and are associated with adverse outcomes.
- Patients with GFR <60 mL/min/1.73 m2 should be evaluated for bone disease and disorders of calcium and phosphorus metabolism.
- Patients with bone disease and disorders of bone metabolism should be evaluated and treated—see forthcoming KDOQI Clinical Practice Guidelines on Bone Metabolism and Disease in Chronic Kidney Disease.
Chronic kidney disease is associated with a variety of bone disorders and disorders of calcium and phosphorus metabolism. The major disorders of bone can be classified into those associated with high parathyroid hormone (PTH) levels (osteitis fibrosa cystica) and those with low or normal PTH levels (adynamic bone disease). The hallmark lesion of chronic kidney disease is osteitis fibrosa, due to secondary hyperparathyroidism. However, with the advent of intensive treatments for secondary hyperparathyroidism, the prevalence of disorders associated with low or normal PTH levels has increased.
Irrespective of the cause, bone disease can lead to pain and an increased incidence of fractures. Abnormal calcium-phosphorus metabolism and hyperparathyroidism can also lead to calcification of blood vessels and potentially an increased risk of cardiovascular events.
The stage of chronic kidney disease at which bone disease begins to develop has not been well documented, nor has a consensus been developed regarding the best screening measures for detecting early abnormalities of calcium-phosphorus metabolism and bone disease. The aim of this guideline is to provide evidence on the association of level of GFR with disorders of calcium-phosphorus metabolism and bone disease and to provide recommendations on how to approach this complication of chronic kidney disease.
Bone Disease in Chronic Kidney Disease
Bone disease associated with chronic kidney disease is composed of a number of abnormalities of bone mineralization. The major disorders can be classified into those associated with high bone turnover and high PTH levels (including osteitis fibrosa, the hallmark lesion of secondary hyperparathyroidism, and mixed lesion) and low bone turnover and low or normal PTH levels (osteomalacia and adynamic bone disease).372 Osteomalacia may be related to vitamin D deficiency, excess aluminum, or metabolic acidosis; whereas adynamic bone disease may be related to over-suppression of PTH with calcitriol.372-374
The pathophysiology of bone disease due to secondary hyperparathyroidism is related to abnormal mineral metabolism: (1) decreased kidney function leads to reduced phosphorus excretion and consequent phosphorus retention; (2) elevated serum phosphorus can directly suppress calcitriol (dihydroxyvitamin D3) production; (3) reduced kidney mass leads to decreased calcitriol production; (4) decreased calcitriol production with consequent reduced calcium absorption from the gastrointestinal tract contributes to hypocalcemia, as does abnormal calcium-phosphorus balance leading to an elevated calcium-phosphorus product.375,376 Hypocalcemia, reduced calcitriol synthesis, and elevated serum phosphorus levels stimulate the production of PTH and the proliferation of parathyroid cells,377-379 resulting in secondary hyperparathyroidism. High PTH levels stimulate osteoblasts and result in high bone turnover. The hallmark lesion of secondary hyperparathyroidism is osteitis fibrosa cystica. High bone turnover leads to irregularly woven abnormal osteoid, fibrosis, and cyst formation, which result in decreased cortical bone and bone strength and an increased risk of fracture.
Low turnover bone disease has two subgroups, osteomalacia and adynamic bone disease. Both lesions are characterized by a decrease in bone turnover or remodeling, with a reduced number of osteoclasts and osteoblasts, and decreased osteoblastic activity. In osteomalacia there is an accumulation of unmineralized bone matrix, or increased osteoid volume, which may be caused by vitamin D deficiency or excess aluminum. Adynamic bone disease is characterized by reduced bone volume and mineralization and may be due to excess aluminum or oversuppression of PTH production with calcitriol.372
Other Complications of Abnormal Calcium-Phosphorus Metabolism
In addition to abnormalities in bone metabolism, abnormal calcium-phosphorus metabolism may lead to calciphylaxis or extraosseous calcification of soft tissue and vascular tissue. This complication in its full manifestation has been reported to affect approximately 1% of dialysis patients.380 However, in studies of coronary artery calcification using electron beam computed tomography, dialysis patients had coronary calcification scores that were several-fold higher than those of patients with known coronary artery disease.381 The pathogenesis remains unclear, but hyperphosphatemia, hypercalcemia, elevated calcium-phosphorus product, and increased PTH levels are probable contributors.
Markers of Bone Disease and Abnormal Calcium-Phosphorus Metabolism in Chronic Kidney Disease
Bone biopsy following double-tetracycline labeling is the gold standard for the diagnosis of bone disease in chronic kidney disease and is the only means of definitively differentiating them. Five bone lesions associated with chronic kidney disease have been classified based on bone formation rate, osteoid area, and fibrosis on bone biopsy of patients with kidney failure372,382 (Table 92).
Bone biopsy is not easy, nor necessary in routine clinical practice. Classically, bone resorption can be seen on plain radiographs in cases of advanced osteitis fibrosa, but radiological studies, including densitometry, have not been conclusively shown to differentiate the various types of bone disease associated with kidney failure. Bone biopsy is currently recommended only for patients with symptomatic disease in whom interventions are being contemplated (such as parathyroidectomy or desferoxamine treatment for elevated aluminum levels)383 or for research of the effectiveness of therapies or alternative diagnostic tests.384 In the absence of direct pathologic studies, clinicians have relied on biochemical data to determine the probable presence of, or assess the risk for, bone abnormalities. Low calcitriol (dihydroxyvitamin D3) and calcium levels, and high phosphorus and PTH levels, are the classic abnormalities which develop with decreased GFR.385 The biochemical studies in common use are serum phosphorus, calcium, and PTH levels. Calcitriol levels can also be measured, but this is not commonly done in clinical practice. Serum phosphorus and calcium levels are used in screening for abnormalities of mineral metabolism that may lead to PTH excess; however, PTH levels may begin to rise even before there is appreciable hyperphosphatemia.379 Hence, the recommendation to obtain PTH levels in the assessment of bone disease in chronic kidney disease.
An ideal serologic marker would be unique to bone and would be well correlated to histologic findings on biopsy. Two markers studied more extensively include PTH and bone alkaline phosphatase (bAP). PTH secretion is directly correlated with bone turnover, but PTH levels are not reliably correlated with bone turnover among dialysis patients, especially in the middle ranges.386,387 PTH levels <65 pg/mL were found to be predictive of normal bone or low turnover lesions, and PTH levels >450 pg/mL were predictive of high turnover lesions, but levels in between did not have good predictive value. Overall bone turnover could not be predicted in 30% of HD and 50% of PD patients.387 In another study, low turnover lesions were noted in the majority of patients with PTH levels <100 pg/mL and high turnover lesions in the majority of patients with PTH levels >200 to 300 pg/mL.386 High bAP levels have been associated with high bone turnover and low levels with adynamic bone disease in dialysis patients. In one study, the combination of high bone alkaline phosphatase levels with high PTH levels increased the sensitivity of diagnosis of high turnover lesions; conversely, low levels of both of these markers result in increased sensitivity for diagnosis of low turnover lesions. However, specific cut-off levels for bAP have varied in the few studies examining the relationship to bone histology.383
Other markers of bone disease not yet fully investigated nor in widespread clinical use include osteocalcin, ß2 microglobulin, procollagen type I carboxy-terminal propeptides (PICP), and type I collagen cross linked telopeptides (ICTP), among others. PICP has been correlated with bone formation, and ICTP and osteocalcin been correlated with bone resorption. However, levels of many of these markers are affected by age, diet, liver function, and kidney function; thus, interpretation of levels is difficult.383
Thus, abnormalities of bone mineral metabolism are present if there is an elevated serum phosphorus or PTH level or reduced serum calcium or calcitriol level. Given the possibility of an elevated PTH level in the face of normal serum calcium and phosphorus levels, the diagnosis of early abnormality of mineral metabolism requires measurement of PTH levels. Extreme elevations of serum PTH levels are more convincingly associated with high turnover lesions than low levels with low turnover lesions. Definitive diagnosis of type of bone disease requires bone biopsy.
Strength of Evidence
Bone disease and disorders of calcium and phosphorus metabolism develop during the course of chronic kidney disease (R). Radiologic and histologic changes of bone disease can be demonstrated in about 40% and nearly 100%, respectively, of patients with severely decreased kidney function and kidney failure.388,389 However, the abnormalities that lead to bone disease begin to occur at earlier stages of chronic kidney disease. Elevated levels of PTH and phosphorus, reduced levels of calcium, and reduced urinary phosphate excretion have been described among patients with GFR <70 mL/min or lower.372,379,386,390,391 Histologic changes have also been shown to occur at earlier stages of chronic kidney disease. In a study of 176 patients with creatine clearances of 15 to 50 mL/min, 75% had "important histological abnormalities, with the majority having osteitis fibrosa with or without osteomalacia."392 In another study of patients with creatinine clearances of 20 to 59 mL/min, 87% of patients had abnormal bone histology, and the majority had lesions of high bone formation rate associated with hyperparathyroidism.374
Bone disease and disorders of bone metabolism are associated with worse outcomes in chronic kidney disease (R). The consequences of abnormal bone mineral metabolism have been studied primarily in patients without kidney disease and in patients with kidney failure.393,394 Hyperparathyroidism has been associated with abnormal bone histology, bone pain, and fractures among patients with either primary and secondary hyperparathyroidism,395-397 and low PTH levels have been more recently recognized to result in an increased risk of vertebral and pelvic fractures.398,399
Calcification of cardiac muscle and coronary vasculature may lead to arrhythmia, left ventricular dysfunction, ischemia, congestive heart failure, and death. Calciphylaxis results in skin lesions that may become infected or gangrenous, leading to significant morbidity and mortality among patients on dialysis.380,394,400 Elevated phosphorus and calcium-phosphorus product has also been linked to increased mortality among patients on dialysis.400,401 It has been hypothesized that elevated phosphorus levels may hasten the loss of kidney function, possibly via calcium-phosphorus precipitation.402
In addition, there is some experimental evidence that elevated PTH levels may be associated with myocardial dysfunction, and impaired skeletal muscle, neurological, and hematopoietic function.393 The impact of PTH levels on mortality appears conflicting. One study of dialysis patients reported an increased risk of death among dialysis patients with low serum PTH levels,400,403 while another study of patients in an emergency room reported an increased risk of death among patients with high PTH levels.404
Onset and severity of bone disease and abnormalities of bone mineral metabolism are related to the level of GFR; below a GFR of approximately 60 mL/min/1.73 m2, there is a higher prevalence of abnormalities of bone metabolism (C, S).
PTH levels are elevated in patients with decreased GFR and likely are the earliest marker of abnormal bone mineral metabolism (Tables 93 and 94 and Figs 36, 37, and 38) (C, S).
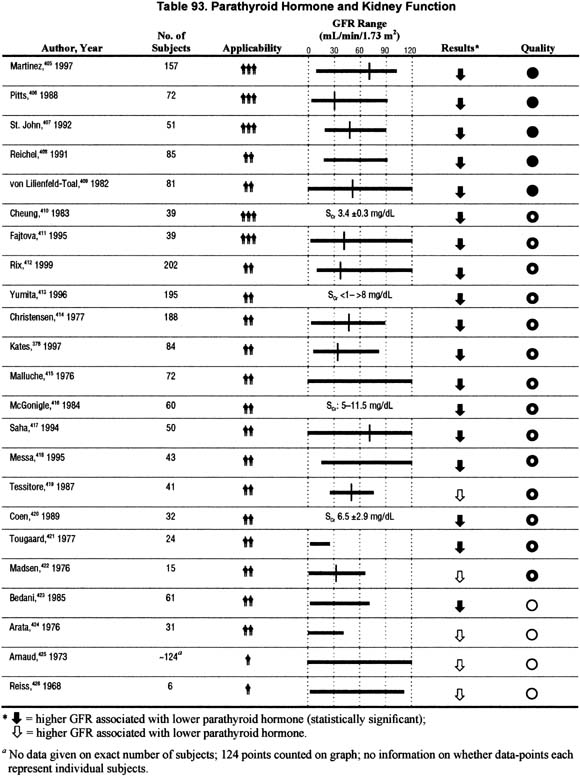
Figure 36 |
|
Scatterplot of iPTH versus GFR. These data are based on the results of 446 patients enrolled in the Canadian Multicentre Longitudinal Cohort study of patients with chronic kidney disease. All patients were referred to nephrologists between 1994 and 1997. No patient was receiving erythropoiten therapy at the time of enrollment, and no patient had an AV fistula. Intact molecule PTH assay is reported in pica moles per liter, and GFR is calculated using the modified MDRD formula (using age, race, gender, and serum creatinine). Adapted and reprinted with permission.288 |
|
Figure 37 |
|
iPTH percentiles by GFR. These data are based on the results of 446 patients enrolled in the Canadian Multicentre Longitudinal Cohort study of patients with chronic kidney disease. All patients were referred to nephrologists between 1994 and 1997. No patient was receiving erythropoiten therapy at the time of enrollment, and no patient had an AV fistula. Intact molecule PTH assay is reported in pica moles per liter, and GFR is calculated using the modified MDRD formula (using age, race, gender, and serum creatinine). Data are presented as median iPTH and 5th and 95th percentiles. Adapted and reprinted with permission.288 |
|
Figure 38 |
|
Prevalence of high iPTH by GFR category. These data are based on the results of 446 patients enrolled in the Canadian Multicentre Longitudinal Cohort study of patients with chronic kidney disease. All patients were referred to nephrologists between 1994 and 1997. No patient was receiving erythropoietin therapy at the time of enrollment, and no patient had an AV fistula. Intact molecule PTH assay is reported in pico moles per liter, and GFR is calculated using the modified MDRD formula (using age, race, gender, and serum creatinine). Adapted and reprinted with permission.288 |
|
The studies relating PTH levels to kidney function date back to the 1960s, with sample sizes ranging from 6 to over 200 subjects with kidney disease. Each of the 23 studies on this topic reviewed for this guideline consistently demonstrated the expected relationship of increasing serum PTH levels with decreasing levels of kidney function. Further details of these studies are presented in Table 93. Because of the variety of assays used to measure PTH and methods used to estimate level of kidney function, no attempt was made to combine data from different studies. However, it is evident and currently accepted that the intact PTH test provides the most consistently reliable measure of PTH levels.
There were four separate studies that examined the threshold creatinine clearance or GFR levels at which PTH levels begin to rise; these threshold levels ranged from <70 mL/min to <40 mL/min.406,411,415,425 In addition, analyses of data from a single study288 demonstrate an inverse correlation between level of GFR and PTH (Figs 36 and 37) and an increasing prevalence of abnormally elevated PTH levels with decreasing GFR (Fig 38). Therefore, the preponderance of data support that serum PTH levels are increased in patients with decreased GFR.
Consistent with these observations, fractional excretion of phosphorous is higher at lower GFRs (Table 94).
Serum calcium levels are frequently, but not consistently, abnormal with decreased GFR (Table 95 and Figs 39 and 40) (C, S).
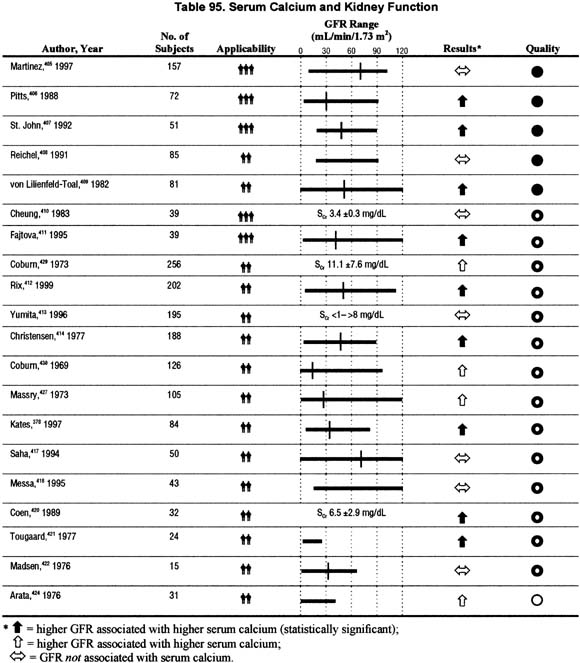
Figure 39 |
|
Serum calcium levels (adjusted for albumin) versus GFR. Median and 5th and 95th percentiles of serum calcium, adjusted for serum albumin, among adult participants age 20 years and older in NHANES III, 1988 to 1994. Values are adjusted to age 60 years using a polynomial quantile regression. The estimated GFR for each individual data point is shown with a plus near the abscissa. 95% confidence intervals at selected levels of estimated GFR are demarcated with triangles, squares, and circles. |
|
Figure 40 |
|
Prevalence of hypocalcemia (adjusted for albumin) versus GFR. These data are based on the results of 446 patients enrolled in the Canadian Multicentre Longitudinal Cohort study of patients with chronic kidney disease. All patients were referred to nephrologists between 1994 and 1997. No patient was receiving erythropoietin therapy at the time of enrollment, and no patient had an AV fistula. GFR is calculated using the modified MDRD formula. Hypocalcemia was defined as serum calcium levels (adjusted for albumin) of <8.5 mg/dL. Adapted and reprinted with permission.288 |
|
The studies relating serum total or ionized calcium levels to kidney function date back to the 1960s, with sample sizes ranging from 15 to over 125 subjects with kidney disease. The studies were conflicting in that about one third (7/20) did not demonstrate the expected relationship between serum calcium levels and kidney function, that is, they did not show lower serum calcium levels among patients with worse kidney function. The remaining studies (13/20) showed that serum calcium levels were lower with lower levels of kidney function.
These data do not consistently show that there is a decrease in calcium levels with declining kidney function. This was not as expected based on the "known" pathophysiology of bone mineral metabolism. The studies showing conflicting results are of similar methodological quality and sample size. In summary, there is not a clear relationship of the level of serum calcium to the level of kidney function over a wide range of kidney function in the reviewed studies.
Similarly, analysis of data from NHANES III does not demonstrate a convincing relationship between serum calcium levels (adjusted for albumin) and level of GFR, although few patients had GFR below 30 ml/min/1.73 m2 (Fig 39).
However, analyses of data from a single study with a large number of individuals with decreased GFR288 demonstrate lower serum calcium levels and higher prevalence of lower serum calcium levels among individuals with lower GFR, in particular below a GFR of < 30 mL/min/1.73 m2 (Fig 40).
The combination of the available information regarding pathophysiology of bone disease in chronic kidney disease and the available evidence reviewed herein would suggest that serum calcium levels are affected by the level of kidney function, though abnormalities in serum calcium levels may not become evident until GFR is <30 mL/min/1.73 m2.
Serum phosphorus levels are elevated in patients with decreased GFR (Table 96 and Figs 41, 42, and 43) (C, S).

Figure 41 |
|
Serum phosphorus levels versus GFR (NHANES III). Median and 5th and 95th percentiles of serum phosphorus among adult participants age 20 years and older in NHANES III, 1988 to 1994. Values are adjusted to age 60 years using a polynomial quantile regression. The estimated GFR for each individual data point is shown with a plus near the abscissa. 95% confidence intervals at selected levels of estimated GFR are demarcated with triangles, squares, and circles. |
|
Figure 42 |
|
Prevalence of low calcium and high phosphate by GFR category. These data are based on the results of 446 patients enrolled in the Canadian Multicentre Longitudinal Cohort study of patients with chronic kidney disease. All patients were referred to nephrologists between 1994 and 1997. No patient was receiving erythropoiten therapy at the time of enrollment, and no patient had an AV fistula. Intact molecule PTH assay is reported in picomoles per liter, and GFR is calculated using the modified MDRD formula (using age, race, gender, and serum creatinine). Low calcium levels are defined as levels 8.5 mg/dL, adjusted for albumin, and high phosphate levels are defined as >4.5 mg/dL. Adapted and reprinted with permission.288 |
|
Figure 43 |
|
Calcium-phosphorus product percentiles by GFR (NHANES III). Median and 5th and 95th percentiles of serum calcium-phosphorus product, adjusted for serum albumin, among adult participants age 20 years and older in NHANES III, 1988 to 1994. Values are adjusted to age 60 years using a polynomial quantile regression. The estimated GFR for each individual data point is shown with a plus near the abscissa. 95% confidence intervals at selected levels of estimated GFR are demarcated with triangles, squares, and circles. |
|
There were 21 studies relating serum phosphorus levels to kidney function reviewed for this guideline. The sample sizes ranged from 15 to over 250 subjects with kidney disease. Fifteen studies showed the expected association of higher serum phosphorus levels with lower kidney function. The remaining 6 studies did not show an association of kidney function with serum phosphorus levels, although one did find a trend for increasing phosphorus levels when creatinine clearance was below 50 mL/min.405 There were four studies that provided sufficient information to determine a threshold level of kidney function at which phosphorus levels start to rise. The apparent threshold GFR ranged from 20 to 50 mL/min/1.73 m2.
In addition, analyses of data from a single study288 and from an analysis of data from NHANES III, demonstrate an increase in serum phosphorus levels (Fig 41) and an increasing prevalence of abnormally elevated serum phosphorus (Fig 42), with lower GFR. Concomitantly, NHANES III data showed that calcium-phosphorus product and prevalence of elevated calcium phosphorus product were higher in individuals with lower GFR (Fig 43).
Overall, these data confirm that serum phosphorus level is higher in individuals with decreased kidney function and suggest that serum phosphorus levels become abnormal in some patients at GFR below approximately 60 mL/min/1.73 m2.
Vitamin D3 levels are decreased among patients with decreased GFR (Table 97) (C).
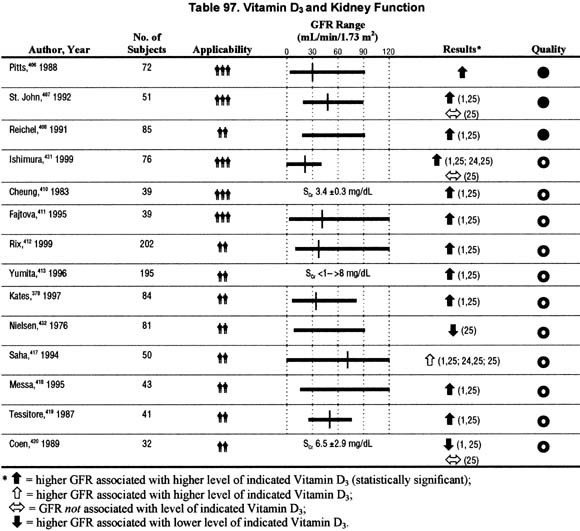
There were 14 studies relating vitamin D3 (calcitriol) levels to kidney function reviewed for this guideline, with sample sizes ranging from 39 to over 200 subjects with kidney disease. Thirteen of the 14 studies evaluated 1,25 dihydroxyvitamin D levels, three of these also evaluated 24,25 dihydroxyvitamin D (2 studies) and/or 25 hydroxyvitamin D levels (3 studies), and one study evaluated only 25 hydroxyvitamin D levels. Each of the 13 studies noted that 1,25 dihydroxyvitamin D levels were lower with decreased kidney function. The two studies evaluating 24,25 dihydroxyvitamin D levels noted lower levels with lower kidney function. The four studies evaluating 25 hydroxyvitamin D levels showed conflicting results.
These data confirm that 1,25 dihydroxyvitamin D levels are lower in patients with decreased kidney function. There is limited information to suggest that 24,25 dihydroxyvitamin D levels are lower in patients with decreased kidney function. The studies do not provide data on the association between level of kidney function and 25 hydroxyvitamin D levels.
Bone histology is abnormal in the majority of patients with kidney failure (Table 98) (C).
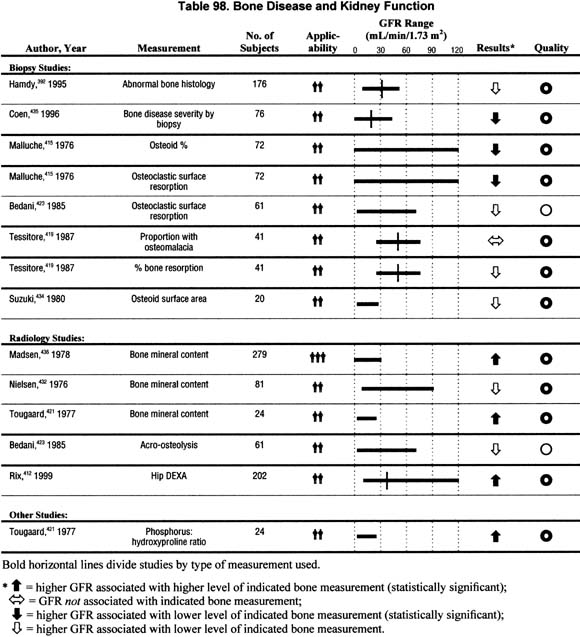
Six articles that related bone biopsy findings to level of kidney function among patients with chronic kidney disease not yet on dialysis were reviewed. The sample sizes ranged from 20 to 176 individuals. The levels of kidney function ranged from nearly normal (creatinine clearance of 117 mL/min) to the initiation of dialysis. Among patients with kidney failure immediately prior to initiation of dialysis, 98% to 100% had abnormal bone histology, with the majority of the biopsies showing either osteitis fibrosa or adynamic bone disease389,433 (data not shown). The studies evaluating patients with varying levels of kidney function demonstrated: (1) a direct relationship between bone mineralization and kidney function415,421; (2) an inverse relationship between kidney function and bone osteoid/resorption415; or (3) a higher prevalence of abnormalities on bone biopsy (osteomalacia, resorption, osteoid) among patients with reduced kidney function.392,419,434,435 In two studies of patients with varying levels of kidney function not yet receiving treatment with vitamin D agents, one374 with 76, the other392 with 176 subjects, 75% to 85% had significant abnormalities on bone biopsy. The majority had osteitis fibrosa, with or without osteomalacia.
There were 4 studies of bone densitometry reviewed for this topic, which demonstrated that bone mineralization is reduced with decreased kidney function. One study presented the results as a higher prevalence of reduced bone mineral content with decreased levels of kidney function. Other studies noted a reduced bone mineral content among patients with decreased kidney function compared to controls. This is insufficient evidence to make firm statements regarding the relationship between bone density and level of kidney function.
These guidelines are limited by the inability to provide a definitive quantitative or semi-quantitative assessment of the relationship between level of kidney function and marker of bone disease. This is in part due to the lack of comparability of many of the studies given the diversity of the laboratory assays or tests for the particular abnormality. This was particularly true for PTH and vitamin D3 (calcitriol) levels, but also applies to bone densitometry. Similarly, the interpretation of bone biopsies and radiographic tests likely has a range of error, in this case related to inter-observer variability.
In addition, as with most of the Guidelines in Part 6, the results are difficult to compare as they use different measures for kidney function: measured GFR or creatinine clearance, estimation equations for GFR or creatinine clearance, or simply serum creatinine.
Lastly, many of the studies involved only few patients with GFR >60 mL/min/1.73 m2. This leads to the extrapolation of the results from other studies to such patients with variable levels of confidence for the various markers.
The data reviewed here suggest that abnormalities of bone/mineral metabolism begin to occur early in kidney disease; thus, the implications are that:
The applications suggested above are based on review of the available literature presented herein and on opinion. The suggestion to follow the biomarkers over time is based on the hypothesis that a change in some of these biomarkers may occur even when there is no change in GFR. In fact, changes in the biomarkers may provide an earlier indication of worsening kidney function.
Treatment recommendations are beyond the scope of this guideline, and will be addressed elsewhere (see KDOQI Bone Metabolism and Disease in CKD Guidelines).
Medicare at present does not cover payment for PTH levels for screening for hyperparathyroidism among patients with chronic kidney disease, unless they have a diagnosis specific to hyperparathyroidism.437 Calcium and ionized calcium tests are also not covered for the evaluation of patients with chronic kidney disease, while phosphate and alkaline phosphate tests are covered.437
Clearly, since the evidence shows that there may be elevation in the PTH level in the setting of normal phosphorus and calcium levels, and high PTH levels are deleterious to bone and non-osseous tissue, policies regarding testing and reimbursement need to be reassessed.
Much of the available information regarding abnormalities of mineral metabolism is derived from studies of patients with kidney failure or severely decreased kidney function. Clearly, more information is needed on the abnormalities of bone mineral metabolism among patients with earlier stages of chronic kidney disease. Moreover, research on outcomes related to abnormal mineral metabolism or bone disease is lacking in both patients with mildly, as well as severely decreased kidney function. In addition to bone complications, there is increasing evidence relating abnormal calcium-phosphorus metabolism and hyperparathyroidism to vascular calcification and cardiovascular complications.
The relationship between levels of the available markers, and levels of kidney function, should be more accurately characterized. In addition, the relationship between such levels and kidney function should be separately studied among patients with additional risks of bone complications, that is, patients treated for prolonged periods with corticosteroids and transplant recipients.
Research should also focus on the impact of interventions on levels of available markers and outcomes, specifically of interest would be comparing patients cared for by nephrologists with those not under the care of nephrologists, patients treated for some specified period of time for hyperparathyroidism compared to those not treated, and patients treated with corticosteroids compared to those never treated with such drugs.