GUIDELINE 9. ASSOCIATION OF LEVEL OF GFR WITH NUTRITIONAL STATUS
Protein energy malnutrition develops during the course of chronic kidney disease and is associated with adverse outcomes. Low protein and calorie intake is an important cause of malnutrition in chronic kidney disease.
- Patients with GFR <60 mL/min/1.73 m2 should undergo assessment of dietary protein and energy intake and nutritional status—see K/DOQI Clinical Practice Guidelines for Nutrition in Chronic Renal Failure (CRF), Guidelines 23 and 26:
GUIDELINE 23. Panels of Nutritional Measures for Nondialyzed Patients: "For individuals with CRF (GFR <20 mL/min) protein-energy nutritional status should be evaluated by serial measurements of a panel of markers including at least one value from each of the following clusters:
(1) Serum albumin;
(2) Edema-free actual body weight, percent standard (NHANES II) body weight, or subjective global assessment (SGA); and
(3) Normalized protein nitrogen appearance (nPNA) or dietary interviews and diaries. (Evidence and Opinion)"
GUIDELINE 26. Intensive Nutritional Counseling for Chronic Renal Failure: "The nutritional status of individuals with CRF should be monitored at regular intervals."
- Patients with decreased dietary intake or malnutrition should undergo dietary modification, counseling, and education or specialized nutrition therapy—see K/DOQI Clinical Practice Guidelines for Nutrition in Chronic Renal Failure (CRF), Guidelines 24 and 25:
GUIDELINE 24. Dietary Protein Intake for Nondialyzed Patients: "For individuals with chronic renal failure (GFR <25 mL/min) who are not undergoing maintenance dialysis, the institution of a planned low-protein diet providing 0.60 g protein/kg/d should be considered. For individuals who will not accept such a diet or who are unable to maintain adequate dietary energy intake with such a diet, an intake of up to 0.75 g protein/kg/d may be prescribed. (Evidence and Opinion)."
GUIDELINE 25. Dietary Energy Intake (DEI) for Nondialyzed Patients: "The recommended DEI for individuals with chronic renal failure (GFR <25 mL/min) who are not undergoing maintenance dialysis is 35 kcal/kg/d for those who are younger than 60 years old and 30-35kcal/kg/d for individuals who are 60 years of age or older. (Evidence and Opinion)."
Anorexia is evidenced by decreased dietary protein intake (DPI) and decreased dietary energy intake (DEI), which are hallmarks of kidney failure (K/DOQI Clinical Practice Guidelines for Nutrition in Chronic Renal Failure,75 Guideline 6). As limitation of protein intake reduces the accumulation of toxic substances derived from the metabolism of protein, decreased DPI may be viewed as adaptive in patients with kidney failure. However, decreased DPI is also associated with worsening of indices of nutritional status. Thus, the overall outcome of this adaptive process may be the increased prevalence of protein energy malnutrition (PEM) in patients with chronic kidney disease.
The stage of chronic kidney disease at which decreased dietary nutrient intake and associated PEM become prevalent has not been adequately documented, due in part to the fact that no single measure provides a complete overview of nutritional status. The optimal monitoring of protein-energy nutritional status requires the collective evaluation of multiple parameters (ie, assessment of visceral protein, muscle mass or somatic protein, body composition). As a result, data for appropriate assessment of nutritional status in patients with chronic kidney disease have not been adequately collected and often the onset and progression of malnutrition is obscured by the progressive loss of kidney function. This guideline provides evidence on the association of the level of GFR with dietary intake and nutritional status and provides recommendations on how to approach this specific complication of chronic kidney disease.
Markers of Protein-Energy Malnutrition
PEM is characterized by the insidious loss of body fat and somatic protein stores, diminished serum protein concentrations, and poor performance status and function. Serum albumin, serum prealbumin, and serum transferrin levels are used to measure visceral protein. Anthropometry and dual-energy x-ray absorptiometry assess somatic protein and fat stores. In addition, edema-free weight, body mass index (BMI), and subjective global assessment (SGA) are valid and clinically useful tools for overall nutritional assessment.
Serum albumin concentration, even when only slightly less than 4.0 g/dL, is one of the most important markers of PEM in patients with chronic kidney disease. It is a very reliable indicator of visceral protein, although its concentration is also affected by its rate of synthesis and catabolism (half-life 20 days), which is altered negatively in the presence of inflammation.314 The distribution of albumin between extra-cellular and intravascular spaces may be variable depending on the etiology of kidney disease, magnitude of proteinuria, and the state of extra-cellular fluid volume. In chronically malnourished patients, albumin tends to shift out of the intravascular compartment.
Several markers of visceral protein, other than albumin, have a shorter half-life and may be useful markers of early malnutrition. Among these are serum transferrin (half-life 8 days) and serum pre-albumin (half-life 2 days).315 Iron stores affect serum transferrin, while pre-albumin is excreted by the kidneys and its concentration can be falsely elevated in patients with advanced kidney disease. All these markers are also affected by the presence of inflammation.
Anthropometry (edema-free weight, BMI, assessment of arm fat and muscle) has been used to estimate body composition and nutritional adequacy. Reproducibility of anthropometry measurements is poor and is dependent upon the skill of the observer. SGA has been proposed as an easy, useful, and clinically valid method for nutritional assessment. SGA includes subjective data (disease state, weight changes), indicators of poor nutritional status (appetite, food intake, gastrointestinal symptoms), and the clinical judgment of the clinician. The limitation of SGA is its reliance on subjective data. There are no studies which correlate anthropometric measurements or SGA with clinical outcome in patients with chronic kidney disease.
Serum bicarbonate concentration (also measured as total carbon dioxide content or CO2), as a measure of acid-base balance, has been used to assess malnutrition in chronic kidney disease. Studies show that uremic acidosis causes an increase in protein degradation. Correction of acidosis is accompanied by a decrease in protein tissue breakdown.316
Assessment of nutrient intake can be useful in identifying PEM and several measures of dietary intake have been utilized in patients with chronic kidney disease. These include measurement of protein equivalent of total nitrogen appearance (PNA) as a marker of dietary protein intake, measurement of basal energy expenditure (BEE) as a measure of dietary energy needs, and dietary interviews or diaries as markers of overall intake. Additionally, total serum cholesterol can be a useful marker for energy intake, but not for protein intake.
The challenge for the clinician is to appropriately monitor the nutritional indices in patients with chronic kidney disease. While each marker has its own advantage in terms of precision and predictability, it is recommended that these markers be used in a complementary fashion to optimize assessment of patients with chronic kidney disease and to tailor specific interventions.75
It is also important for the clinician to educate patients about a proper diet, since hyperphosphatemia, hyperkalemia, and metabolic acidosis may develop during chronic kidney disease.
Medical Nutrition Therapy and Nutrition Counseling
As of January 2002, Medicare will provide payment for medical nutrition therapy (MNT) for patients with chronic kidney disease.317
"Medical nutrition therapy involves the assessment of the nutritional status of patients with a condition, illness, or injury that puts them at risk. This includes review and analysis of medical and diet history, laboratory values, and anthropometric measurements. Based on the assessment, nutrition modalities most appropriate to manage the condition or treat the illness or injury are chosen and include the following:
- Diet modification, counseling, and education leading to the development of a personal diet plan to achieve nutritional goals and desired health outcomes.
- Specialized nutrition therapies including supplementation with medical foods for those unable to obtain adequate nutrients through food intake only; enteral nutrition delivered via tube feeding into the gastrointestinal tract for those unable to ingest or digest food; and parenteral nutrition delivered via intravenous infusion for those unable to absorb nutrients."
Presently, it is proposed that patients will be eligible to receive reimbursement for medical nutrition therapy if they have GFR 15 to 50 mL/min/1.73 m2, or if they have received a kidney transplant within the previous 6 months. These criteria are roughly equivalent to patients with CKD Stages 3-4 and Stage 5 who do not yet require dialysis. Most patients with CKD Stage 5 who are treated by dialysis are eligible for medical nutrition therapy from their dialysis providers.
Strength of Evidence
PEM develops during the course of chronic kidney disease (R). When compared to the demographically adjusted general population, dialysis patients experience greater signs and symptoms of wasting, malnutrition, morbidity, and mortality. It is estimated that 50% to 70% of dialysis patients suffer from PEM.314 Abnormalities in nutritional markers are common and include decreased serum proteins, lower body mass as assessed by anthropometric measurements and SGA, and decreased nutrient intake. Reasons for PEM include disturbances in protein and energy metabolism, hormonal derangements, anorexia, and nausea and vomiting related to uremic toxicity. Comorbid conditions such as diabetes, vascular disease, and superimposed infections and inflammation are contributory.318
Malnutrition is associated with worse outcomes in chronic kidney disease (R). Among maintenance dialysis patients, PEM has been recognized as one of the most significant predictors of adverse outcomes. Risk of hospitalizations and mortality is inversely correlated to nutritional markers.319 Recently, attention has focused on the characteristics of patients with chronic kidney disease at the time they begin maintenance dialysis. Studies have suggested that apart from the severity of uremic symptoms as well as the biochemical findings related to the extent of metabolic and hormonal abnormalities, the nutritional status of the patient at the initiation of dialysis is a clinically significant risk factor for subsequent clinical outcomes (morbidity and mortality) on dialysis.320,321 The association between nutrition intake or status and clinical outcome does not prove a causal relationship. It is possible that comorbid conditions independently impair both nutritional intake or status and increase morbidity and mortality. In addition studies suggest that a combined state of poor nutritional status and inflammation predispose patients with chronic kidney disease to poor clinical outcomes.322,323
Low protein and calorie intake is an important cause of malnutrition in chronic kidney disease (R). While there are possibly multiple factors that contribute to the development of PEM in chronic kidney disease, low protein and calorie intake (decreased from usual intake) are certainly important contributors in this catabolic process. This relationship is evident from multiple studies, which show a strong relationship between the amount of dietary intake of nutrients, especially protein intake, and the stage of malnutrition in patients with chronic kidney disease.324,325 Concentrations of serum albumin and transferrin, edema free weight, and percent lean body mass have all been directly related to dietary protein intake in patients with chronic kidney disease.
The mechanism by which chronic kidney disease leads to this decline in nutrient intake has not been defined. Accumulation of uremic toxins due to loss of kidney function is a potential explanation. Metabolic and hormonal derangements predispose patients with chronic kidney disease to decreased appetite and dietary nutrient intake.326,327 Specific comorbid conditions, such as diabetes mellitus, cardiovascular disease, and depression, can facilitate the worsening of decreased nutrient intake in patients with chronic kidney disease. The mechanisms associated with these conditions are multiple and include gastrointestinal abnormalities, decreased appetite, effects of concomitant medication use, and role of inflammation.
Other causes of malnutrition in chronic kidney disease (R). Several factors other than low protein and calorie intake can also predispose chronic kidney disease patients to malnutrition. These include several hormonal and metabolic derangements related to loss of kidney function. Metabolic acidosis is commonly seen in chronic kidney disease patients and shown to be associated with increased protein catabolism in these patients. Specifically, the degradation of the essential, branched-chain amino acids and muscle protein is stimulated during metabolic acidosis. Further, metabolic acidosis suppresses albumin synthesis.328 Worsening kidney function is also associated with resistance to insulin, growth hormone and insulin-like growth factor 1, all of which are known to be anabolic hormones. Of note, these abnormalities are most prominent in pediatric chronic kidney disease patients with apparent growth failure.329-331
Recent studies point to the increased concentrations of proinflammatory cytokines and acute phase reactants in chronic kidney disease patients.323,332 Analysis of the data from NHANES III demonstrates increasing C-reactive protein concentrations as GFR decreases.333 Thus, available evidence suggests a chronic inflammatory state in chronic kidney disease patients, especially for patients in Stages 3 to 5. The metabolic and nutritional effects of chronic inflammation are many and include anorexia, increased skeletal muscle protein breakdown, increased whole body protein catabolism, cytokine-mediated hypermetabolism, and disruption of the growth hormone and IGF-1 axis leading to decreased anabolism.334-336 These findings suggest that chronic inflammation observed in chronic kidney disease patients is an important causative factor for poor nutritional status observed in these patients.
The level of dietary intake of protein and energy intake is related to the level of GFR; below a GFR of approximately 60 mL/min/1.73 m2, there is a higher prevalence of reduced dietary protein and energy intake (Tables 81 and 82 and Fig 30) (C, S).
Figure 30 |
|
Association of dietary intake and GFR in the MDRD Study. Mean levels of protein and energy intake as a function of GFR based on 24-hour urine collections and diet diaries (males, solid lines; females, dashed lines). Data depict MDRD Study enrollees not on restricted diets. Abbreviation: UNA, urea nitrogen appearance. Reprinted with permission.324 |
|
One of the most significant clinical indicators of kidney failure is an apparent decrease in appetite. Spontaneous decrease in dietary protein and energy intake can be regarded as an early index of uremia. This begins to occur when GFR falls below 60 mL/min/1.73 m2. As protein and calorie intake decline, markers of nutrition health indicate worsening nutritional status.
K/DOQI Nutrition Guideline 24 recommends consideration of a protein intake of 0.60 g/kg/d for individuals with GFR <25 mL/min (corresponding approximately to CKD Stages 4-5), but does not address recommendations for patients with higher GFR. The recommended dietary allowance (RDA) of protein for normal adults is 0.75 g/kg/d. The MDRD Study was inconclusive regarding the benefits of protein restriction on kidney disease progression (see CKD Guideline 13), but there was no evidence of a beneficial effect from DPI higher than the RDA. A DPI of 0.75 g/kg/d therefore appears reasonable for patients with CKD Stages 1-3 (in the absence of evidence of malnutrition), but data are inconclusive, and individualized decision-making is advised. Patients with DPI less than approximately 0.75 g/kg/d should have more close monitoring of nutritional status.
K/DOQI Nutrition Guideline 25 recommends age-dependent DEI intakes of 30 to 35 kcal/kg/d for individuals with GFR <25 mL/min (corresponding approximately to CKD Stages 4-5), but does not address recommendations for patients with higher GFR. The RDA for energy intake in normal adults depends on energy expenditure. Average energy intake in adults in the United States is less than that recommended in the K/DOQI Nutrition Guideline. The rationale for higher DEI in patients with GFR <25 mL/min is based on studies demonstrating more efficient nitrogen utilization at higher energy intakes. For patients with CKD Stages 1-3, it would be reasonable to recommend higher energy intakes only if they have abnormally low body weight or show other signs of malnutrition.
Patients with DPI less than the RDA (0.75 g/kg/d) should be targeted for frequent follow-up to monitor nutritional status more closely. Some studies indicate that intensive nutrition counseling may help maintain calorie intake and to preserve markers of good nutrition as GFR declines.299,324,325,337-342
The onset and severity of PEM is related to the level of GFR; below a GFR of approximately 60 mL/min/1.73 m2, there is a higher prevalence of impaired nutritional status (C, S). K/DOQI Nutrition Guideline 23 states that protein-energy nutritional status should be evaluated by serial measurements for individuals with GFR <20 mL/min.75 An updated literature review supports the recommendation that evaluations of nutritional status should begin when GFR falls below approximately 60 mL/min/1.73 m2. Population studies show that albumin begins to decline once GFR reaches this level.333 Other markers of nutritional status at this level of kidney function have not been as well studied.
K/DOQI Nutrition Guideline 23 recommends a panel of nutrition measures for evaluation of nutrition status in nondialyzed patients which includes serum albumin, body weight, subjective global assessment and assessment of protein intake through nPNA or dietary interviews. Other markers of nutritional status (eg, serum total proteins, serum prealbumin, serum transferrin, serum total bicarbonate, serum total cholesterol, and serum lipids) appear to be related to the level of GFR.
The calculation of standard body weight (SBW) requires a formula that uses elbow breadth to determine the patient's frame size. For many clinicians, this measurement is not feasible. The calculation of healthy weight range can be made with the simpler Body Mass Index (BMI) formula:
![]()
It is recommended that the BMI of maintenance dialysis patients be maintained in the upper 50th percentile for normal individuals, which would mean a BMI for men and women no lower than approximately 23.6 to 24.0 kg/m2. This recommendation also appears appropriate for chronic kidney disease patients with significant GFR reductions (Stages 3-5)—see K/DOQI Nutrition Guideline, Appendix VII.
K/DOQI Nutrition Guideline 26 recommends monitoring of nutritional status at 1- to 3-month intervals in patients with GFR <20 mL/min. It is the opinion of the CKD Work Group that this recommendation is appropriate for patients with GFR less than 30 ml/min/1.73 m2 (CKD Stages 4-5) and less frequent monitoring (eg, every 6 to 12 months) may be acceptable for patients with GFR 30 to 60 mL/min/1.73m2 (CKD Stage 3) if there is no evidence of malnutrition.
The high prevalence of malnutrition in chronic kidney disease, the association between malnutrition and clinical outcomes, and new evidence that nutrient intake begins to decline at GFR <60 mL/min/1.73 m2 support the recommendation that nutritional status should be assessed and monitored earlier in the course of chronic kidney disease.
Serum albumin level is lower in patients with decreased GFR (Tables 83 and 84 and Figs 31 and 32) (C, S).
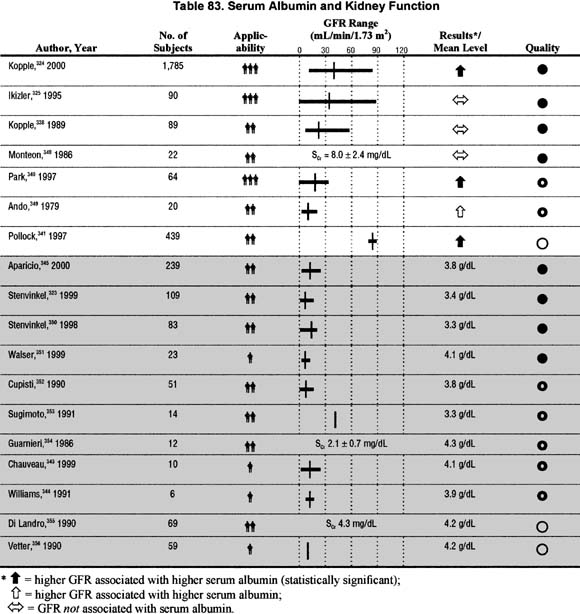
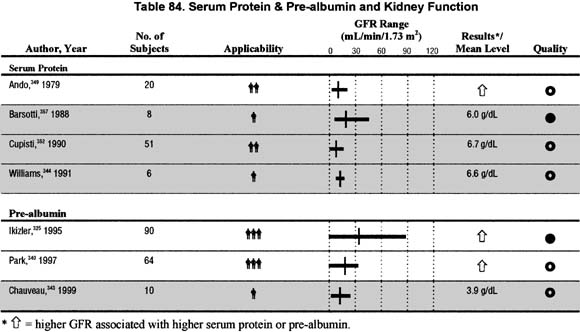
Figure 31 |
|
Serum albumin percentiles by GFR adjusted to age. Median and 5th and 95th percentiles of serum albumin among adult participants age 20 years and older in NHANES III, 1988 to 1994. Values are adjusted to age 60 years using a polynomial quantile regression. The estimated GFR for each individual data point is shown with a plus near the abscissa. 95% confidence intervals at selected levels of estimated GFR are demarcated with triangles, squares, and circles. |
|
Figure 32 |
|
Association of serum albumin and GFR in the MDRD Study. Mean levels of serum albumin and the probability of serum albumin concentrations <3.8g/dL as a function of GFR (males, solid lines; females, dashed lines). Reprinted with permission.324 |
|
Serum albumin is lower at levels of GFR below 60 mL/min/1.73 m2, indicating a decline in circulating protein levels or serum protein concentrations, protein losses or inflammation.324,325,338,340,341,348,349 An acceptable goal level for albumin is >4.0 g/dL (bromcresol green method).
Similar findings have been reported for serum total proteins and pre-albumin.
Serum transferrin level is lower in patients with decreased GFR (Table 85 and Fig 33) (C, S).
Figure 33 |
|
Association of serum transferrin and GFR in the MDRD Study. Mean levels of serum transferrin and the probability of serum transferrin concentrations <250 mg/dL as a function of GFR (males, solid lines; females, dashed lines). Reprinted with permission.324 |
|
Serum transferrin is lower at lower GFR levels. This is evidenced in patients with chronic kidney disease, with no sign of inflammation, infection, and with stable iron status.324,325,338,340
Serum bicarbonate concentration is lower in patients with decreased GFR (Table 86) (C).
As GFR falls to <60 mL/min/1.73 m2, serum bicarbonate decreases. Low serum bicarbonate is an indicator of acidemia and associated with protein degradation. Low serum bicarbonate has been correlated to low serum albumin.325,340 See K/DOQI Clinical Practice Guidelines for Nutrition in Chronic Renal Failure, Guideline 14, Treatment of Low Serum Bicarbonate:
"Predialysis or stabilized serum bicarbonate levels should be maintained at or above 22 µmol/L."75
Serum cholesterol concentration is lower in patients with decreased GFR (Table 87 and Fig 34) (C, S).
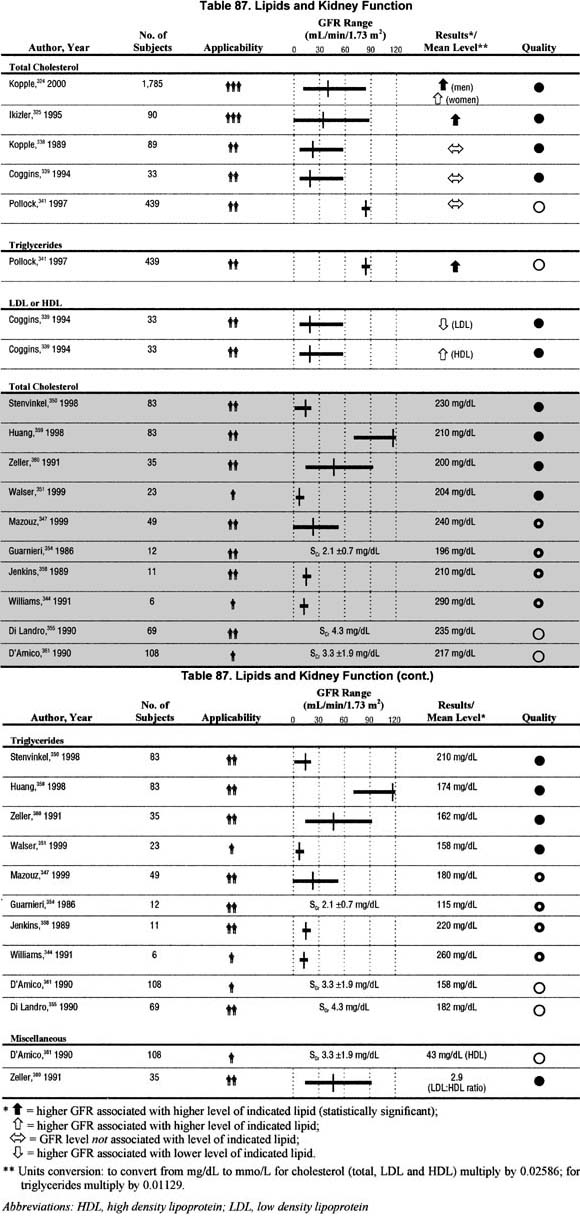
Figure 34 |
|
Association of serum cholesterol and GFR in the MDRD Study. Mean levels of serum cholesterol and the probability of serum cholesterol concentrations <160 mg/dL as a function of GFR (males, solid lines; females, dashed lines). Reprinted with permission.324 |
|
As GFR decreases to <60 mL/min/1.73 m2, serum cholesterol falls, even when controlling for inflammation and comorbid conditions.324,325,338,339,341
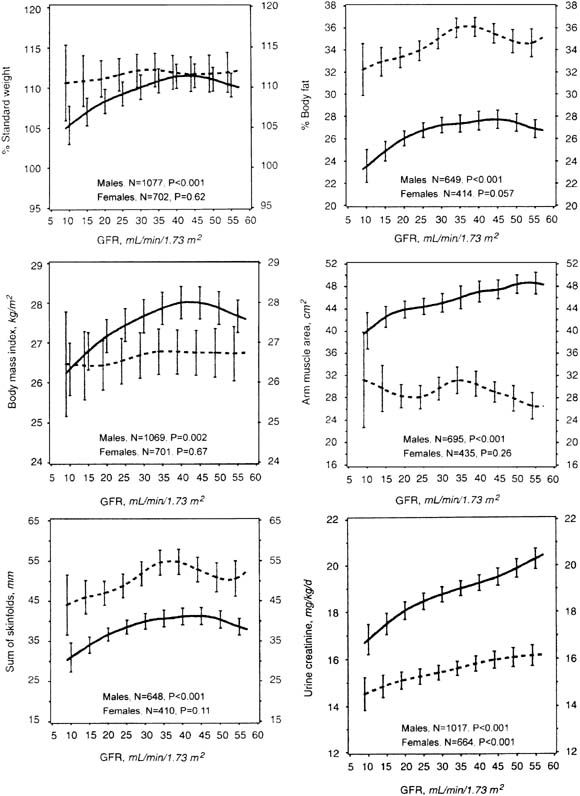
Body weight, body mass index, percentage body fat, and skin fold thickness are lower in patients with decreased GFR (Tables 88, 89, 90, and 91 and Fig 35) (C, S).
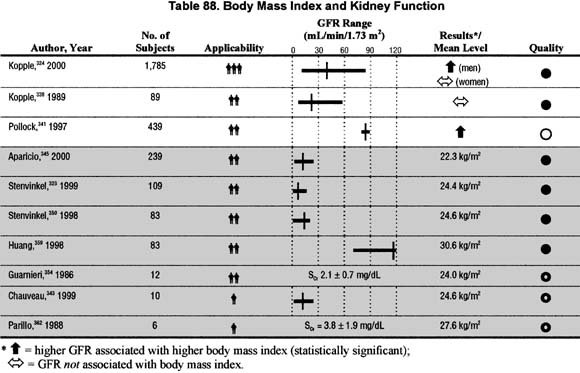
Figure 35 |
|
Association of body composition and GFR in the MDRD Study. Mean levels of anthropometric measures of nutritional status as a function of GFR (males, solid lines; females, dashed lines). Reprinted with permission.324 |
|
As GFR falls to <50 mL/min/1.73 m2, measurements of body mass show declines in total mass, fat, and muscle. The correlations may be stronger in men than women. Assessment of body composition, especially with serial measurements can provide valuable information concerning long term adequacy of protein energy nutrition. Changes in body weight, BMI, and body fat in patients with chronic kidney disease and GFR >60 mL/min/1.73 m2 have not been assessed.324,338,341
There are certain limitations to the information presented herein. The design of most studies measuring nutrition markers in chronic kidney disease is based on data derived from cross-sectional studies. There are very few longitudinal studies available. In addition, there is a lack of uniform collective evaluation of the multiple markers of nutritional status in patients with chronic kidney disease. Although it is known that dietary nutrient intake decreases with GFR, there is only limited evidence that decreased dietary protein intake per se causes poor nutritional status. However, research indicates that when patients receive intensive nutrition therapy and monitoring while the GFR is declining, nutrition status can be maintained.337,343,345,351,358,365-367
In the United States, implementation of the medical nutrition therapy law for reimbursement through Medicare will allow for the provision of nutrition monitoring as described in these guidelines. Studies show that the most effective nutrition interventions in patients with chronic kidney disease involve patient training in self management skills and frequent, ongoing feedback, and interventions with the nutrition team.368-371 Medical nutrition therapy for patients with chronic kidney disease must therefore include adequate time for nutrition assessment and education and regular, scheduled nutrition appointments.
Although occasionally a care provider, or other individual, may possess the expertise and time to conduct nutritional assessment, use dietary interviews and records to assess protein energy intake, assess body muscle and fat stores, interpret biochemical markers of nutrition status and relate to dietary intake, and provide nutritional therapy (develop a plan for nutritional management, counsel the patient and family on appropriate dietary protein energy intake, monitor nutrition intake, and provide encouragement to maximize dietary adherence)—a registered dietitian, trained and experienced in CKD nutrition, is best qualified to carry out these tasks. Such an individual not only has undergone all of the training required to become a registered dietitian, including in many instances a dietetic internship, but has also received formal or informal training in CKD nutrition. Such a person is particularly experienced in working with patients with chronic kidney disease and the nephrology team (see K/DOQI Clinical Practice Guidelines for Nutrition in Chronic Renal Failure, Appendix IV, Role of the Renal Dietitian 75).
Although the data presented herein is compelling, more research, especially prospective studies evaluating the impact of kidney disease on nutritional parameters, is needed. Importantly, studies to define the optimal methods to evaluate nutritional status in chronic kidney disease patients are critical. Prospective studies evaluating the impact of different levels of nutritional status on subsequent outcome in chronic kidney disease patients should also be performed. Finally, prospective studies evaluating the impact of intensive nutritional counseling on nutritional status and possibly clinical outcome in chronic kidney disease patients should be carried out.