| Table 1. | Goals of the CKD Work Group |
| Table 2. | Definition of Chronic Kidney Disease |
| Table 3. | Stages of Chronic Kidney Disease: A Clinical Action Plan |
| Table 4. | Stages and Prevalence of Chronic Kidney Disease (Age ≥ 20) |
| Table 5. | Potentially Modifiable Risk Factors for Development and Progression of Chronic Kidney Disease According to Stage |
| Table 6. | Approach to the Evidence Review |
| Table 7. | Published Guidelines and Recommendation for Chronic Kidney Disease |
| Table 8. | Questions and Methods |
| Table 9. | Types of Risk Factors for Adverse Outcomes of Chronic Kidney Disease |
| Table 10. | Stages of Chronic Kidney Disease |
| Table 11. | Definition of Chronic Kidney Disease |
| Table 12. | Definition and Stages of Chronic Kidney Disease |
| Table 13. | Prevalence of GFR Categories: NHANES III 1988–1994 US Adults Age ≥ 20 |
| Table 14. | Prevalence of Stages of Chronic Kidney Disease and Levels of Kidney Function in the US |
| Table 15. | Definitions of Proteinuria and Albuminuria |
| Table 16. | Albumin Excretion Rate: Normal Range in Children |
| Table 17. | Urine Albumin-to-Creatinine Ratio: Normal Range in Children |
| Table 18. | Prevalence of Albuminuria in Adults: NHANES III |
| Table 19. | Prevalence of Albuminuria by Age Group: NHANES III |
| Table 20. | Prevalence of Albuminuria Among Individuals With a History of Diabetes: NHANES III |
| Table 21. | Prevalence of Albuminuria Among Individuals Without a History of Diabetes: NHANES III |
| Table 22. | Proteinuria: Prevalence in Nondiabetic Children |
| Table 23. | Albuminuria: Prevalence in Nondiabetic Children |
| Table 24. | Normal GFR in Children and Young Adults |
| Table 25. | Normal GFR in Adults Extrapolated From Data in 72 Healthy Men |
| Table 26. | Prevalence of GFR Categories in Adults |
| Table 27. | Description of MDRD Study Participants Who Developed Kidney Failure: Kidney Function |
| Table 28. | Description of MDRD Study Participants Who Developed Kidney Failure: Dietary Intake and Nutritional Status |
| Table 29. | Comparison of Kidney Function Measurements in MDRD Study Participants Who Developed Kidney Failure |
| Table 30. | GFR at Start of Hemodialysis |
| Table 31. | Creatinine Clearance at Start of Hemodialysis |
| Table 32. | Serum Creatinine at Start of Hemodialysis |
| Table 33. | Stages of Chronic Kidney Disease: A Clinical Action Plan |
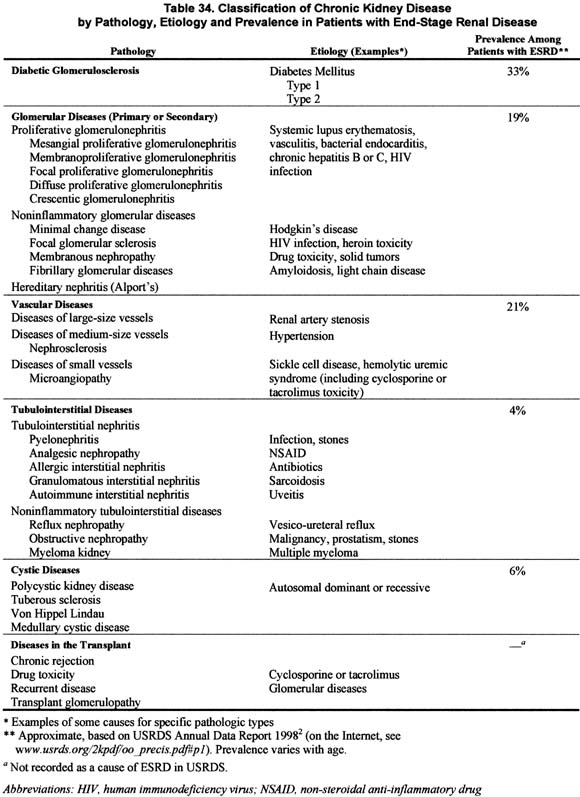
| Table 34. | Classification of Chronic Kidney Disease by Pathology, Etiology and Prevalence in Patients With End-Stage Renal Disease |
| Table 35. | Classification and Management of Comorbid Conditions in Chronic Kidney Disease |
| Table 36. | Association of Stages of Chronic Kidney Disease With Complications |
| Table 37. | Factors Linked With Noncompliance in Chronic Kidney Disease |
| Table 38. | Classification of Risk Factors |
| Table 39. | Types and Examples of Risk Factors for Chronic Kidney Disease |
| Table 40. | Potential Risk Factors for Susceptibility to and Initiation of Chronic Kidney Disease |
| Table 41. | Relationship Between Types of Kidney Disease and Risk Factors for Initiation and Susceptibility to Chronic Kidney Disease |
| Table 42. | Prevalence of Individuals at Increased Risk for Chronic Kidney Disease |
| Table 43. | Factors Affecting Serum Creatinine Concentration |
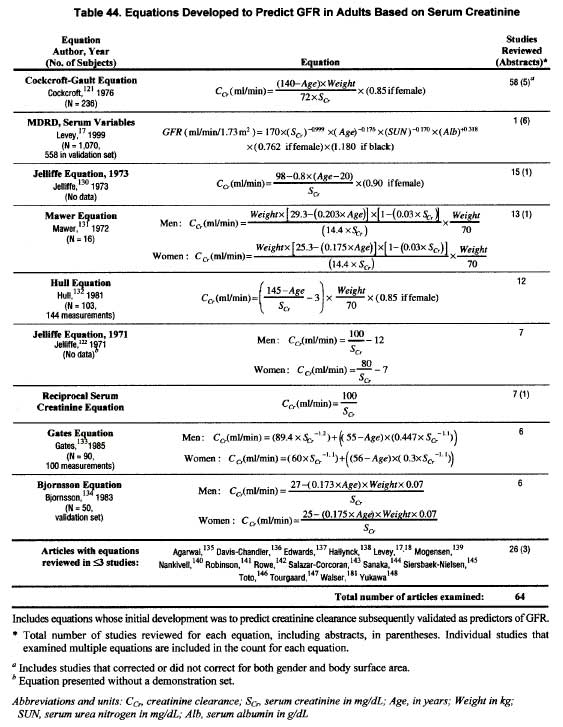
| Table 44. | Equations Developed to Predict GFR in Adults Based on Serum Creatinine |
| Table 45. | Equations Developed to Predict GFR in Children Based on Serum Creatinine |
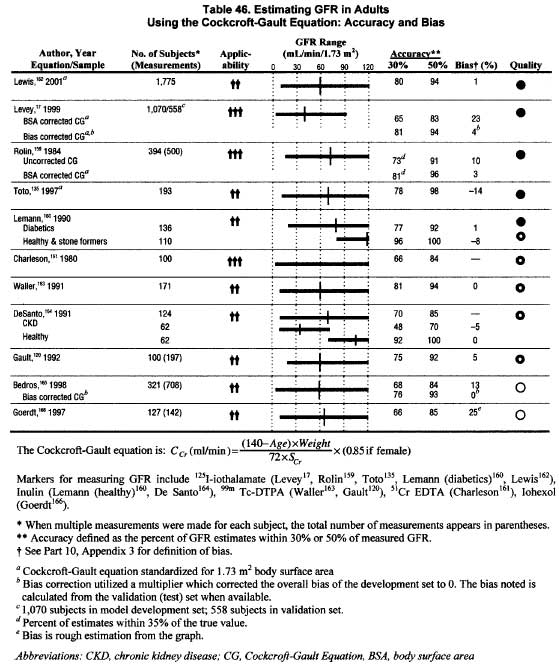
| Table 46. | Estimating GFR in Adults Using the Cockcroft-Gault Equation: Accuracy and Bias |
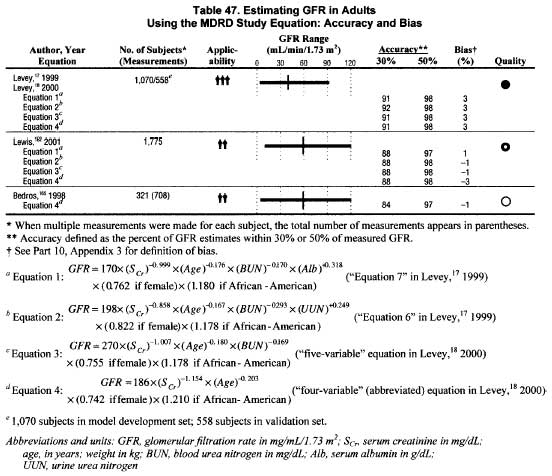
| Table 47. | Estimating GFR in Adults Using the MDRD Study Equation: Accuracy and Bias |
| Table 48. | Abbreviated MDRD Study Equation |
| Table 49. | Serum Creatinine Corresponding to an Estimated GFR of 60 mL/min/1.73 m2 by the Abbreviated MDRD Study and Cockcroft-Gault Equations |
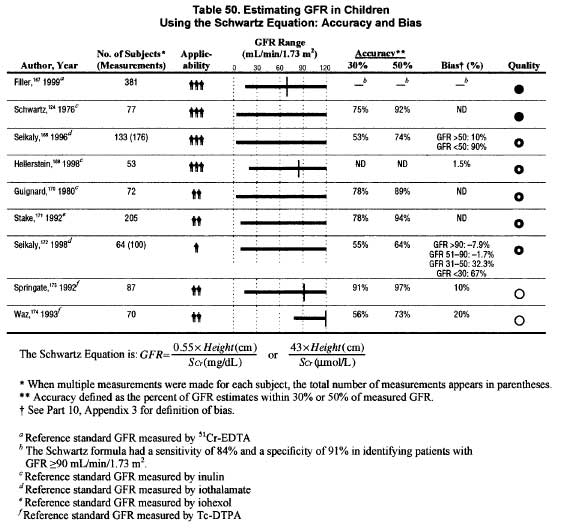
| Table 50. | Estimating GFR in Children Using the Schwartz Equation: Accuracy and Bias |
| Table 51. | Estimating GFR in Children Using the Counahan-Barratt or Modified Counahan-Barratt Equations: Accuracy and Bias |
| Table 52. | Clinical Situations in Which Clearance Measures May Be Necessary to Estimate GFR |
| Table 53. | Spot Urine Protein vs. Timed Urine Protein in Adults |
| Table 54. | Spot Urine Albumin vs. Timed Urine Albumin in Adults |
| Table 55. | Spot Urine Dipstick Albumin vs. Timed Urine Albumin in Adults |
| Table 56. | Spot Urine Protein-to-Creatinine Ratio vs. Timed Urine Protein in Adults |
| Table 57. | Spot Urine Albumin-to-Creatinine Ratio vs. Timed Urine Albumin in Adults |
| Table 58. | Spot Urine Protein-to-Creatinine Ratio vs. Timed Urine Protein in Nondiabetic Children. |
| Table 59. | Spot Urine Albumin-to-Creatinine Ratio vs. Timed Urine Albumin in Children |
| Table 60. | Comparison of Methods for Urine Collection for Assessment of Proteinuria |
| Table 61. | Common Causes of False Results in Routine Measurements of Urinary Albumin or Total Protein |
| Table 62. | Interpretation of Proteinuria and Urine Sediment Abnormalities as Markers of Chronic Kidney Disease |
| Table 63. | Interpretation of Abnormalities on Imaging Studies as Markers of Kidney Damage |
| Table 64. | Clinical Presentations of Kidney Disease |
| Table 65. | Relationship Between Types of Kidney Disease and Clinical Presentations |
| Table 66. | Retinol Binding Protein (RBP): Association With Various Outcomes |
| Table 67. | N-Acetyl-ß-D-Glucosaminidase (NAG): Association With Various Outcomes |
| Table 68. | ß-2-Microglobulin (ß-2-MG): Association With Various Outcomes |
| Table 69. | Sodium Dodecyl Sulfate-Polyacrylamide Gel Electrophoresis (SDS-PAGE): Association With Various Outcomes |
| Table 70. | Urinary Cell Excretion: Association With Various Outcomes |
| Table 71. | Classification of Blood Pressure for Adults ≥18 Years (JNC-VI) |
| Table 72. | Pathogenetic Mechanisms of High Blood Pressure in Chronic Kidney Disease |
| Table 73. | Association of Mean Arterial Pressure and Cardiovascular Disease Events in Incident Dialysis Patients |
| Table 74. | Recommended Research on High Blood Pressure in Chronic Kidney Disease: Observational Studies |
| Table 75. | Recommended Research on High Blood Pressure in Chronic Kidney Disease: Clinical Trials |
| Table 76. | Hemoglobin and Kidney Function |
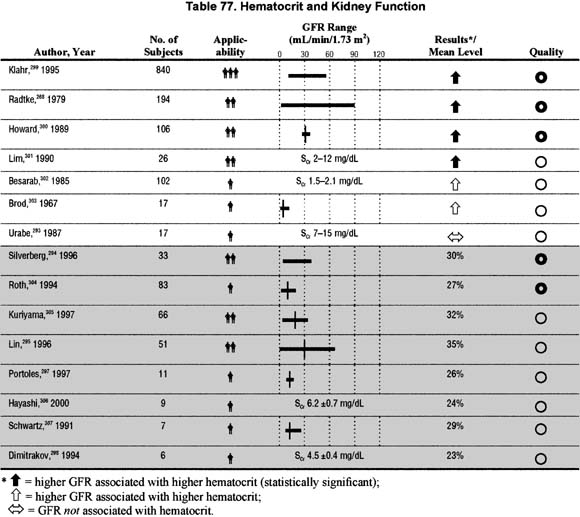
| Table 77. | Hematocrit and Kidney Function |
| Table 78. | Erythropoietin Level and Kidney Function |
| Table 79. | Ferritin and Kidney Function |
| Table 80. | Miscellaneous Hematological Measures and Kidney Function |
| Table 81. | Daily Calorie Intake and Kidney Function |
| Table 82. | Daily Protein Intake and Kidney Function |
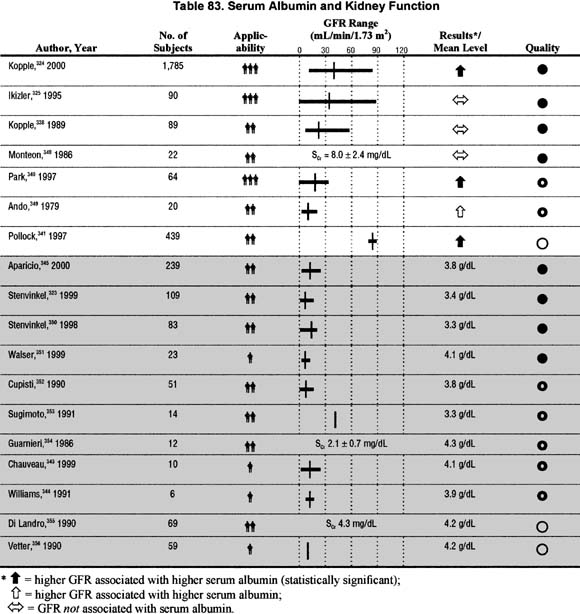
| Table 83. | Serum Albumin and Kidney Function |
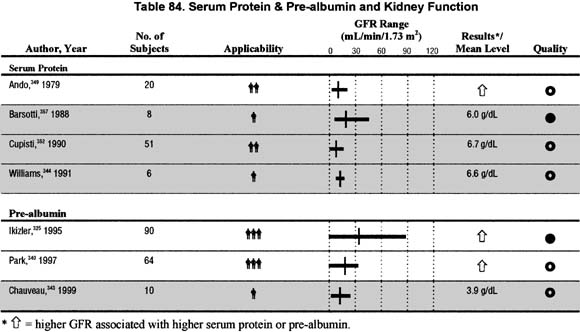
| Table 84. | Serum Protein and Prealbumin and Kidney Function |
| Table 85. | Transferrin and Kidney Function |
| Table 86. | Serum Bicarbonate and Kidney Function |
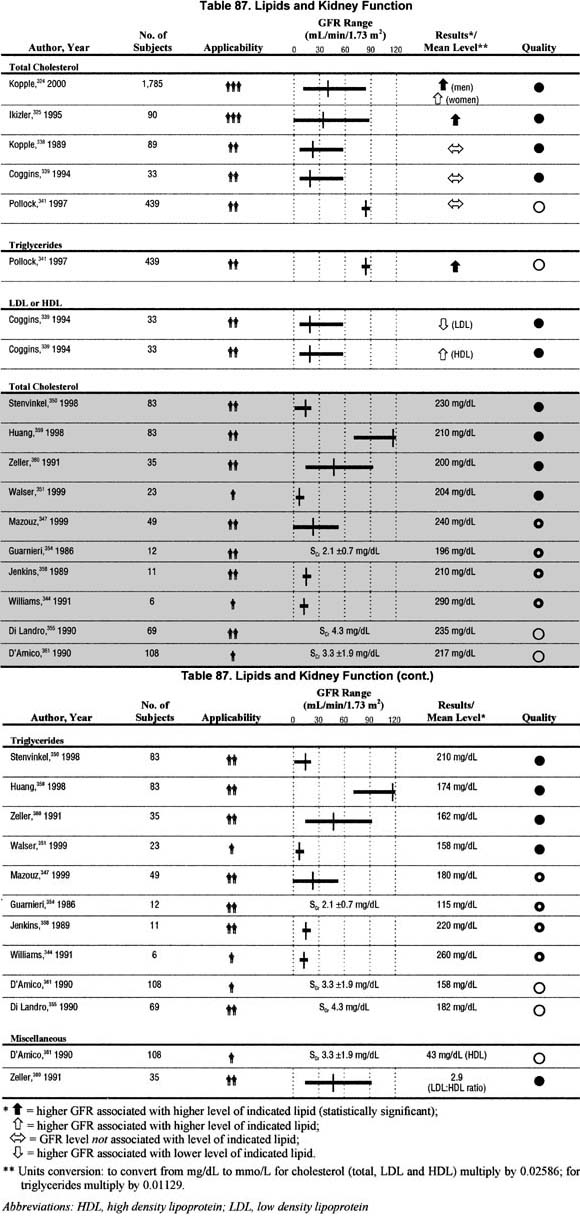
| Table 87 | Lipids and Kidney Function |
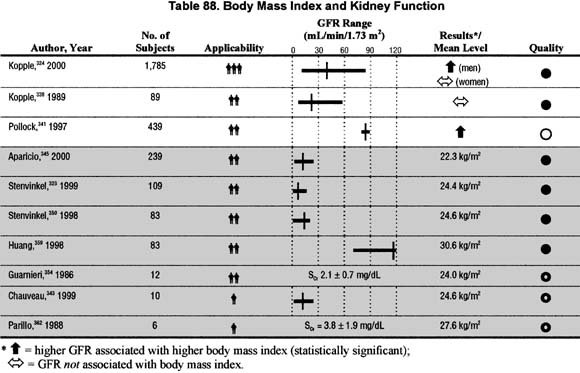
| Table 88. | Body Mass Index and Kidney Function |
| Table 89. | Ideal or Standard Body Weight and Kidney Function |
| Table 90. | Body Tissue Composition (Muscle) and Kidney Function |
| Table 91. | Body Tissue Composition (Fat) and Kidney Function |
| Table 92. | Histologic Classification of Bone Lesions Associated With Kidney Disease |
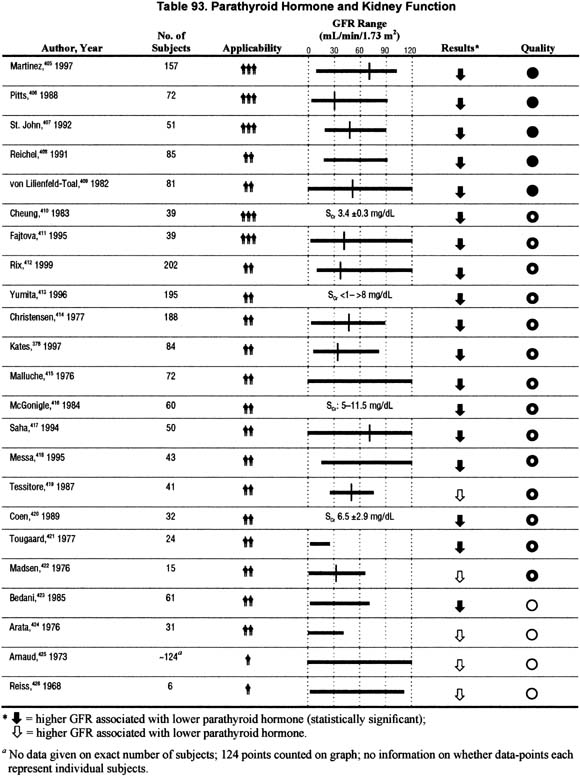
| Table 93. | Parathyroid Hormone and Kidney Function |
| Table 94. | Fractional Excretion of Phosphorus and Kidney Function |
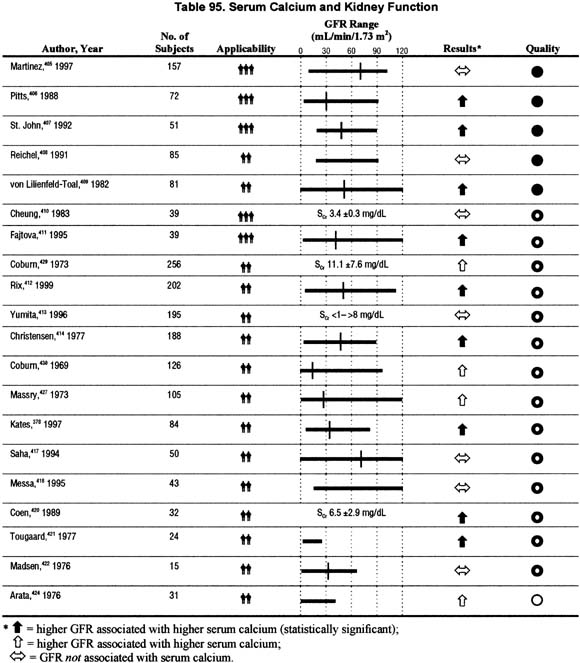
| Table 95. | Serum Calcium and Kidney Function |
| Table 96. | Serum Phosphate and Kidney Function |
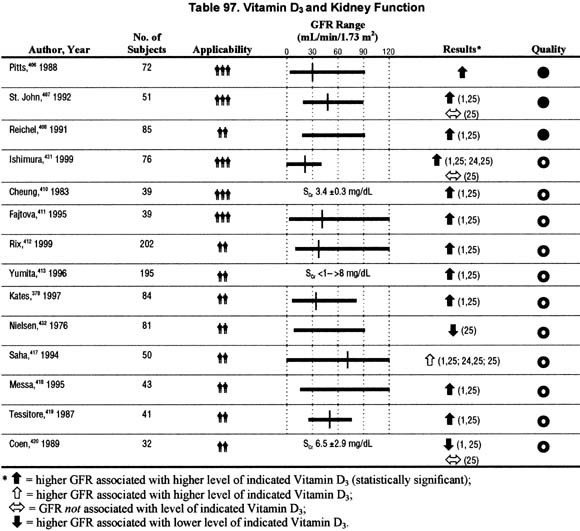
| Table 97. | Vitamin D3 and Kidney Function |
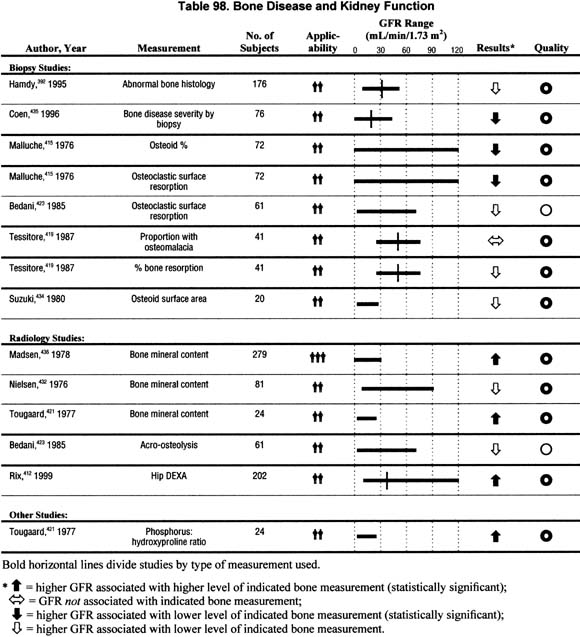
| Table 98. | Bone Disease and Kidney Function |
| Table 99. | Nerve Conduction Velocity and Kidney Function |
| Table 100. | Miscellaneous Neurological Measurements and Kidney Function |
| Table 101. | Autonomic Function and Kidney Function |
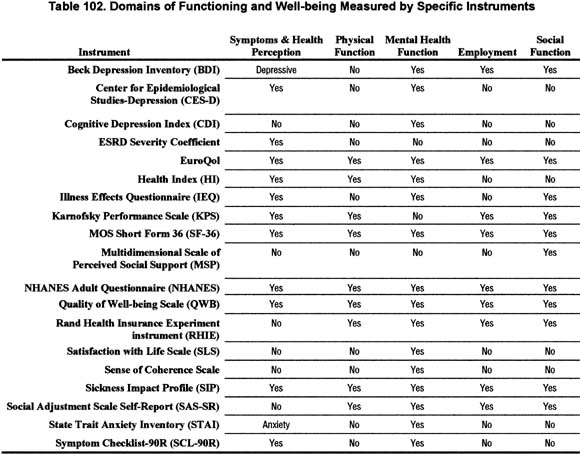
| Table 102. | Domains of Functioning and Well-Being Measured by Specific Instruments |
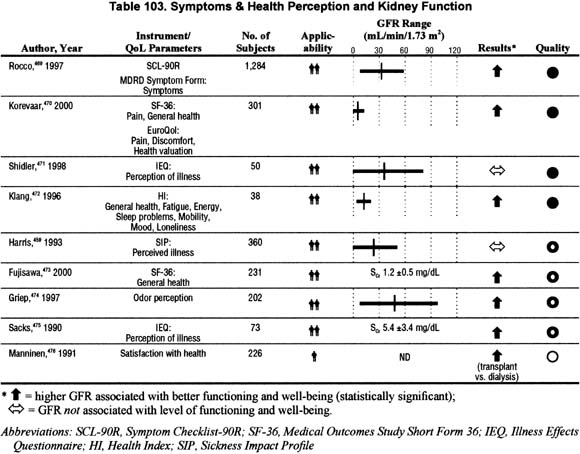
| Table 103. | Symptoms and Health Perception and Kidney Function |
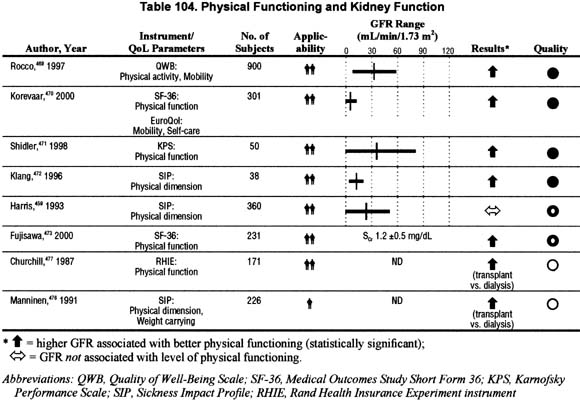
| Table 104. | Physical Functioning and Kidney Function |
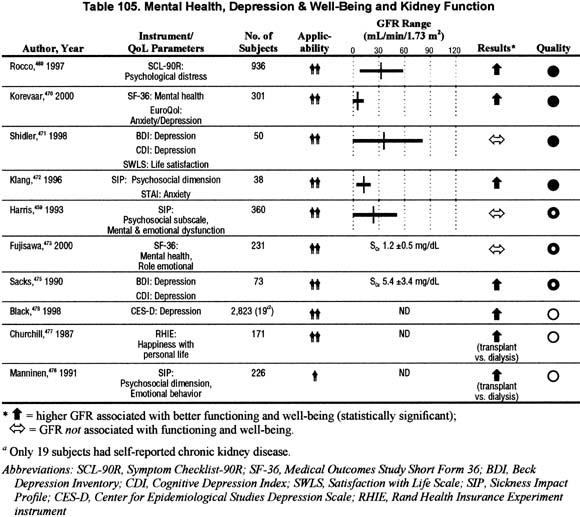
| Table 105. | Mental Health, Depression, and Well-Being and Kidney Function |
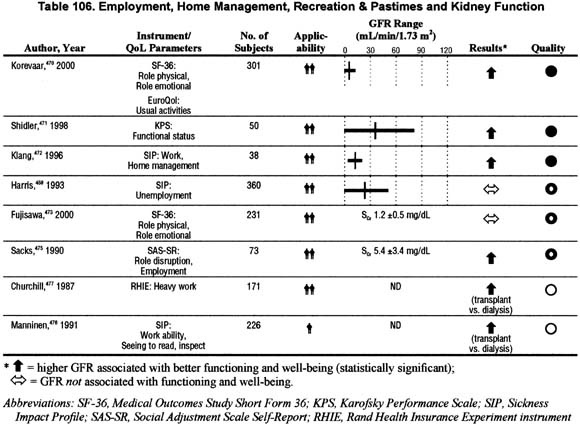
| Table 106. | Employment, Home Management, Recreation, and Pastimes and Kidney Function |
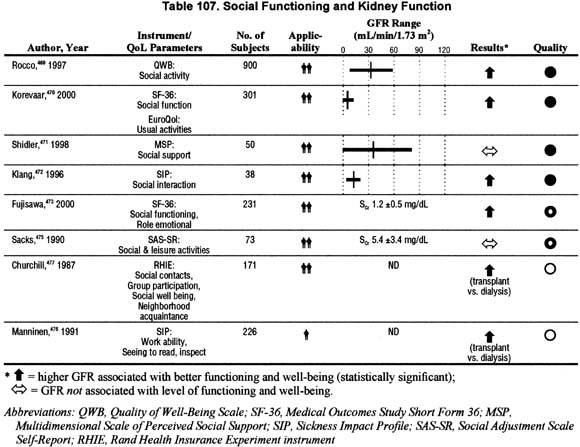
| Table 107. | Social Functioning and Kidney Function |
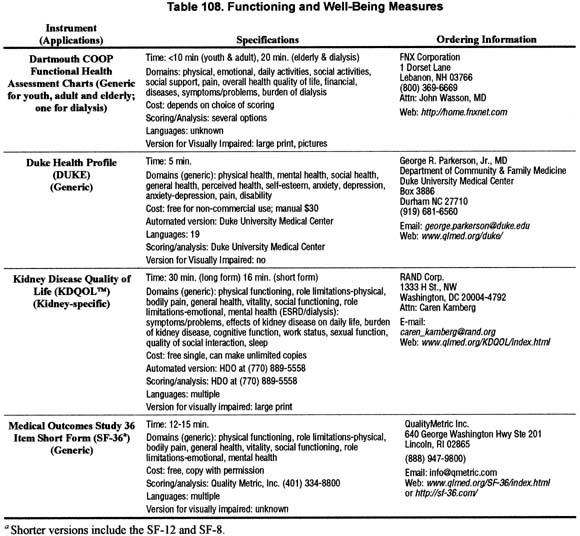
| Table 108. | Functioning and Well-Being Measures |
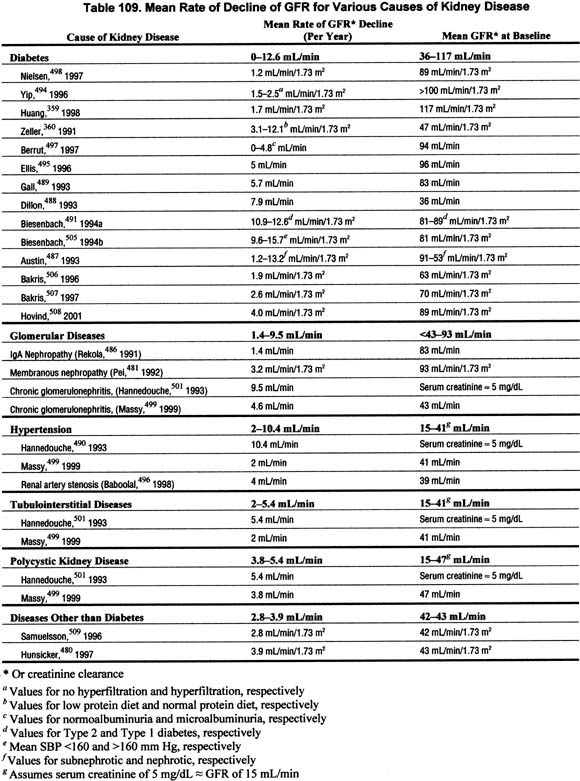
| Table 109. | Mean Rate of Decline of GFR for Various Causes of Kidney Disease |
| Table 110. | Years Until Kidney Failure (GFR <15 mL/min/1.73 m2) Based on Level of GFR and Rate of GFR Decline |
| Table 111. | Kidney Disease Type as Predictor of Progression |
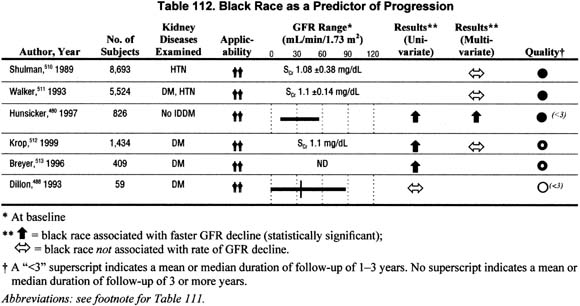
| Table 112. | Black Race as a Predictor of Progression |
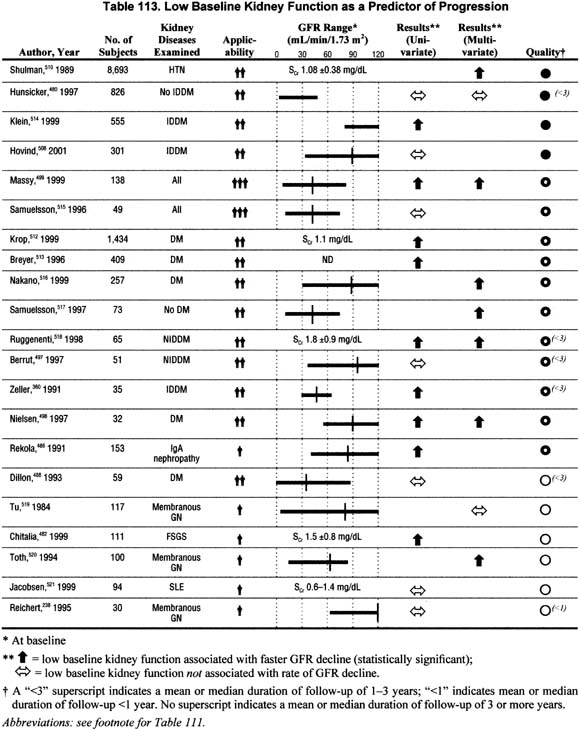
| Table 113. | Low Baseline Kidney Function as a Predictor of Progression |
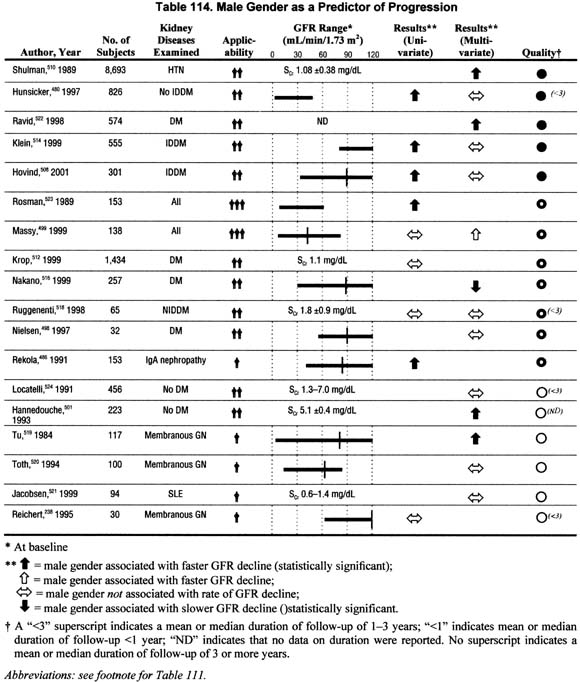
| Table 114. | Male Gender as a Predictor of Progression |
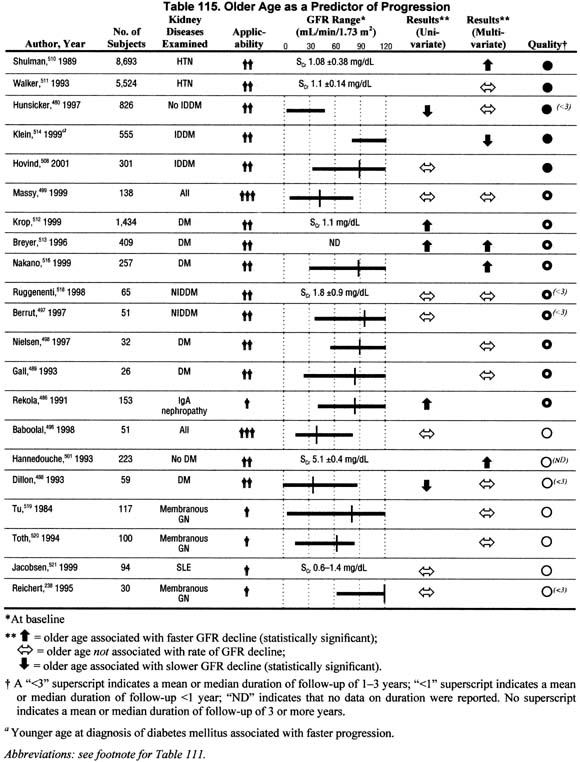
| Table 115. | Older Age as a Predictor of Progression |
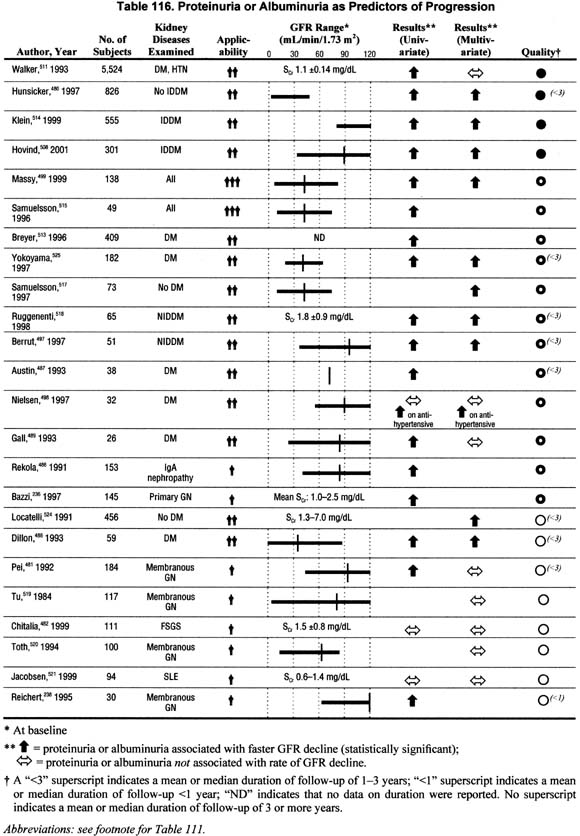
| Table 116. | Proteinuria or Albuminuria as Predictors of Progression |
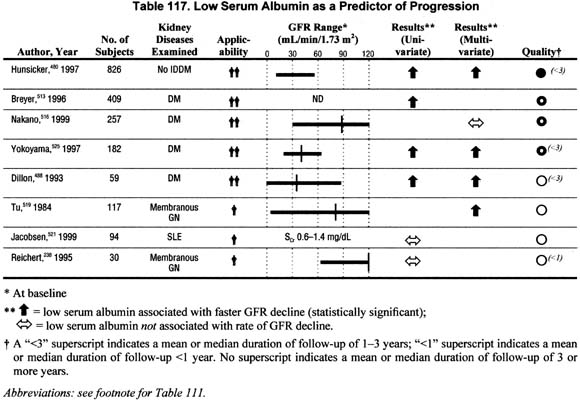
| Table 117. | Low Serum Albumin as a Predictor of Progression |
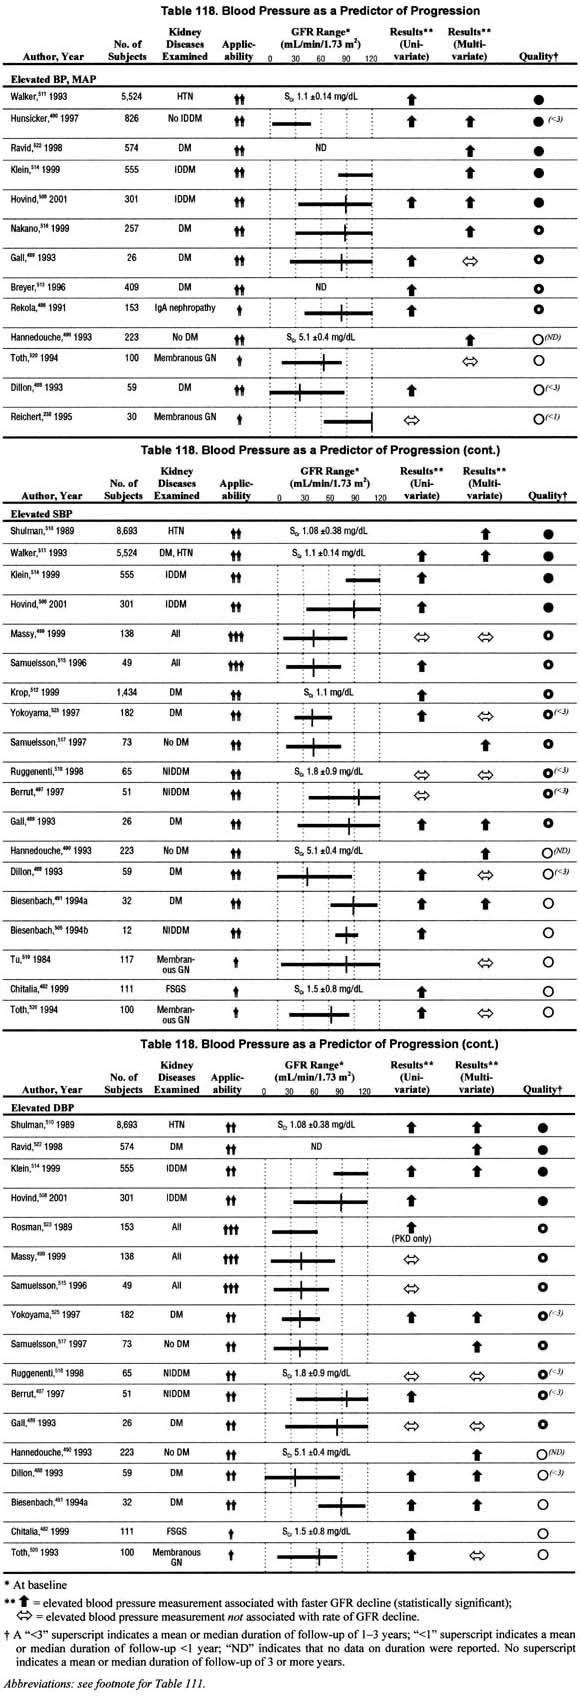
| Table 118. | Blood Pressure as a Predictor of Progression |
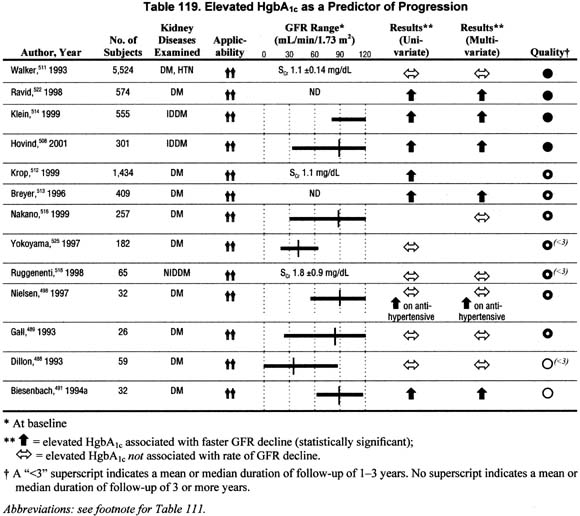
| Table 119. | Elevated HgbA1c as a Predictor of Progression |
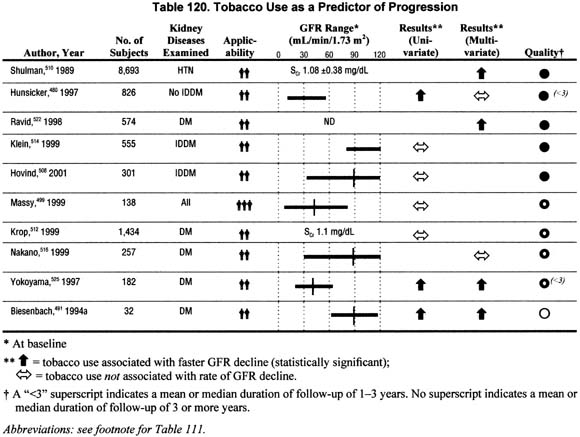
| Table 120. | Tobacco Use as a Predictor of Progression |
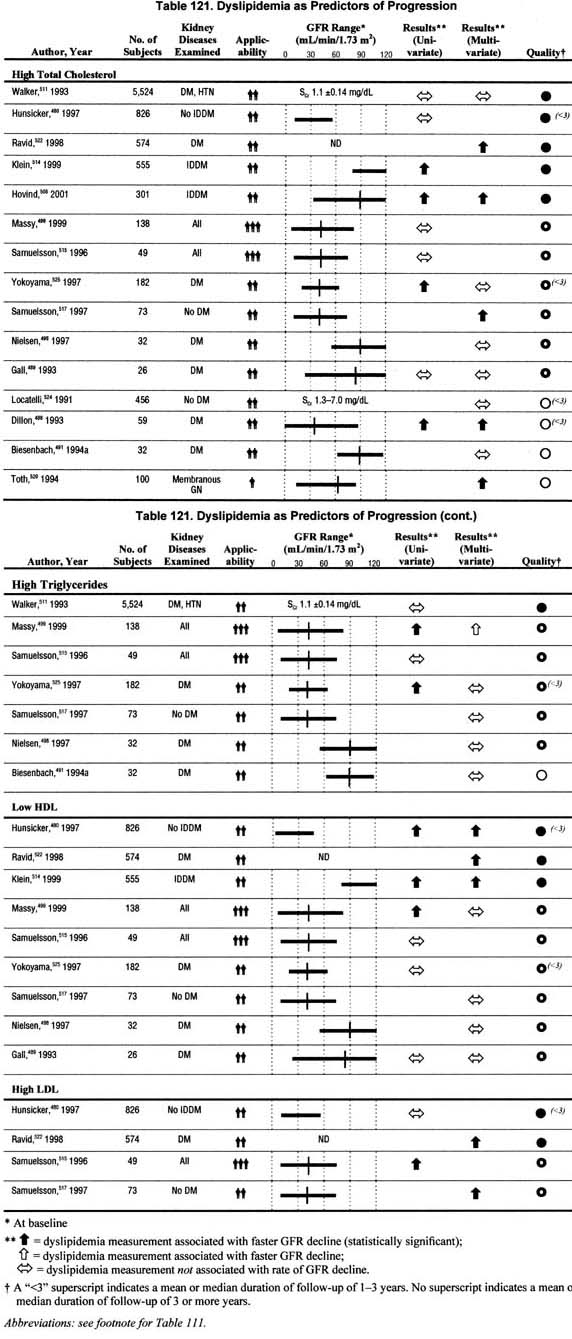
| Table 121. | Dyslipidemia as Predictors of Progression |
| Table 122. | Anemia as a Predictor of Progression |
| Table 123. | Recommendations for Glycemic Control for People With Diabetes |
| Table 124. | Risk Stratification and Indication for Antihypertensive Treatment |
| Table 125. | Blood Pressure, Goals, Nonpharmacologic, and Pharmacologic Therapy Recommended by the NKF Task Force on Cardiovascular Disease in Chronic Renal Disease |
| Table 126. | Research Classification of Diabetic Polyneuropathy |
| Table 127. | Prevalence of Atherosclerotic Cardiovascular Disease According to the Stage of Kidney Disease in Various Racial/Ethnic Groups With Type 2 Diabetes |
| Table 128. | Prevalence of Retinopathy According to the Stage of Kidney Disease in Various Racial/Ethnic Groups With Type 2 Diabetes |
| Table 129. | Guidelines and Position Statements on Care of Diabetic Complications |
| Table 130. | Traditional vs. Chronic Kidney Disease-Related Factors Potentially Related to an Increased Risk for Cardiovascular Disease |
| Table 131. | Lipoprotein Abnormalities in the General Population and in Patients With Chronic Kidney Disease |
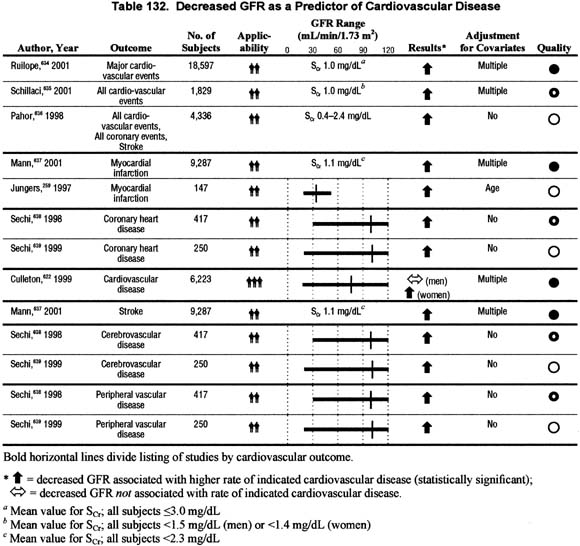
| Table 132. | Decreased GFR as a Predictor of Cardiovascular Disease |
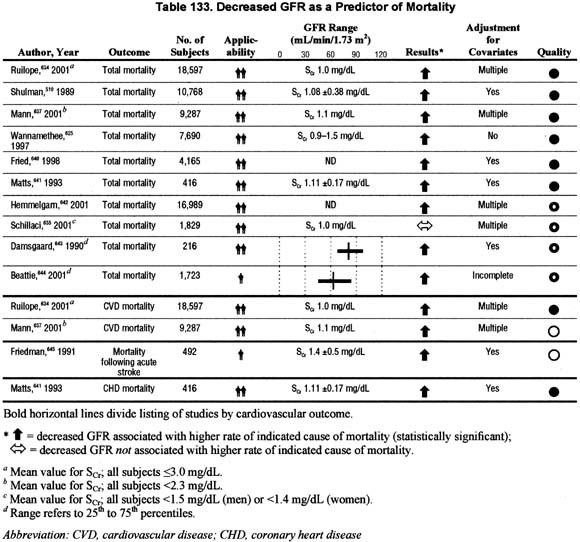
| Table 133. | Decreased GFR as a Predictor of Mortality |
| Table 134. | Proteinuria as a Predictor of Cardiovascular Disease |
| Table 135. | Proteinuria as a Predictor of Cardiovascular Mortality. |
| Table 136. | Proteinuria as a Predictor of Total Mortality |
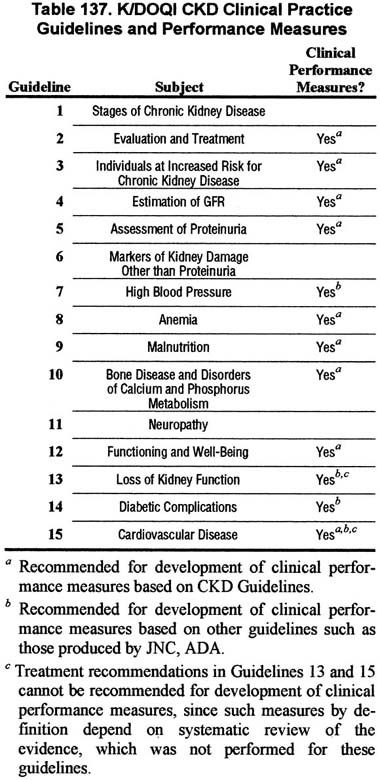
| Table 137. | KDOQI CKD Clinical Practice Guidelines and Performance Measures |
| Table 138. | Clinical Evaluation of Patients at Increased Risk of Chronic Kidney Disease |
| Table 139. | Stages of Chronic Kidney Disease: Clinical Presentations |
| Table 140. | Simplified Classification of Chronic Kidney Disease by Diagnosis |
| Table 141. | Clues to the Diagnosis of Chronic Kidney Disease From the Patient's History |
| Table 142. | Laboratory Evaluation of Patients With Chronic Kidney Disease |
| Table 143. | Stages and Clinical Features of Diabetic Kidney Disease |
| Table 144. | Stages and Clinical Features of Nondiabetic Kidney Disease |
| Table 145. | Stages and Clinical Features of Diseases in the Kidney Transplant |
| Table 146. | Treatments to Slow the Progression of Chronic Kidney Disease in Adults |
| Table 147. | "Traditional" Risk Factors for Chronic Kidney Disease and Associated Interventions |
| Table 148. | Additional Clinical Interventions for Adults With GFR <60 mL/min/1.73 m2 |
| Table 149. | Clinical Evaluation of Elderly Individuals With GFR of 60-89 mL/min/1.73 m2 |
| Table 150. | Evaluation of Studies of Prevalence |
| Table 151. | Diagnostic Test Evaluation |
| Table 152. | Evaluation of Clinical Associations |
| Table 153. | Evaluation of Studies of Prognosis |
| Table 154. | Literature Search and Review by Topic |
| Table 155. | Format for Guidelines |