NKF KDOQI GUIDELINES
KDOQI Clinical Practice Guidelines for Managing Dyslipidemias in Chronic Kidney Disease
Assessment of Dyslipidemias
IN EACH OF the following guideline statements, kidney transplant recipients are included along with other patients with CKD, whether or not they have other evidence of CKD. Each guideline statement is followed by a letter grade (in parentheses) indicating the strength of the recommendation (Table 7).
Guideline 1
1.1. All adults and adolescents with CKD should be evaluated for dyslipidemias. (B)
1.2. For adults and adolescents with CKD, the assessment of dyslipidemias should include a complete fasting lipid profile with total cholesterol, LDL, HDL, and triglycerides. (B)
1.3. For adults and adolescents with Stage 5 CKD, dyslipidemias should be evaluated upon presentation (when the patient is stable), at 2–3 months after a change in treatment or other conditions known to cause dyslipidemias; and at least annually thereafter. (B)
Associations Between Dyslipidemias and ACVD in CKD
The incidence of ACVD is very high in patients with CKD (Fig 5). Therefore, the NKF Task Force on CVD and the KDOQI Work Group on CKD both concluded that, in the management of risk factors such as dyslipidemia, patients with CKD should be considered to be in the highest risk category, ie, equivalent to that of patients with known CHD.2,4 There is very strong evidence from the general population that dyslipidemias cause ACVD, and this evidence has led to the ATP III guidelines for evaluation and treatment.3 It is conceivable that the pathogenesis of ACVD is different in patients with CKD, and that dyslipidemias do not contribute to ACVD in CKD.
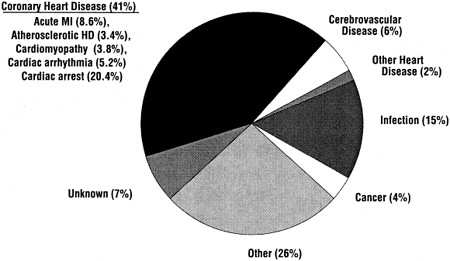
Fig 5. Causes of death among period prevalent patients 1997–1999, treated with hemodialysis, peritoneal dialysis, or kidney transplantation. Data are from the USRDS 2001 Annual Data Report (www.usrds.org). Abbreviations: MI, myocardial infarction; HD, heart disease.
However, the relationship between dyslipidemias and ACVD in the general population is robust, ie, it is valid in men and women3,46,47; old and middle-aged3,46,47; smokers and non-smokers3,47; hypertensive and non-hypertensive patients47; diabetics and nondiabetics3,48; and individuals with higher or lower LDL,3,47 higher or lower total cholesterol,3,47 higher or lower triglycerides,3,47 and higher or lower HDL (Fig 4).3,47,49,50 There are no compelling reasons to assume that dyslipidemias do not contribute to ACVD in patients with CKD as well.
There are no randomized, controlled, intervention trials testing the hypothesis that dyslipidemias cause ACVD in patients with CKD. However, in an observational study of 3,716 patients initiating treatment for Stage 5 CKD in 1996, the use of statins in 362 (9.7%) was independently associated with lower all-cause mortality and a reduction in CVD deaths during follow-up.84 Unfortunately, it is likely that the patients using statins had other favorable characteristics that were not accounted for in the adjusted analysis, but may have explained their reduced risk for CVD independent of their use of statins. Therefore, these study results are consistent with, but do not prove, the hypothesis that dyslipidemias contribute to ACVD in patients with CKD.
Associations Between Dyslipidemias and ACVD in Hemodialysis Patients
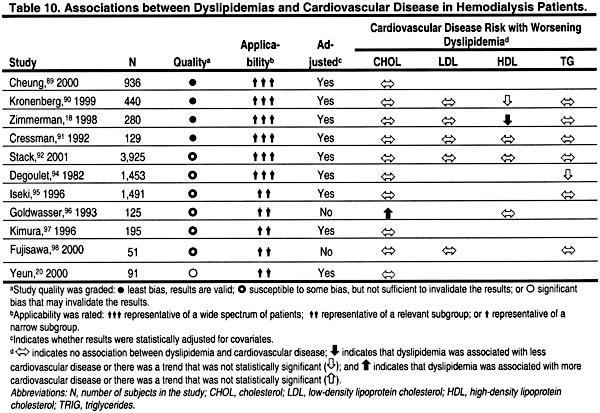
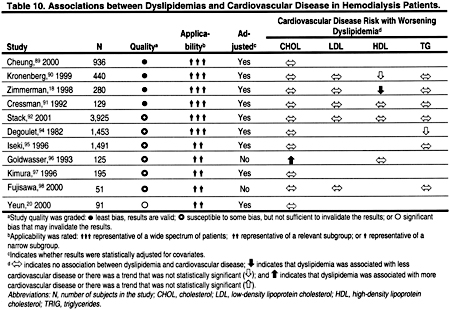
There are no large, prospective, observational studies examining the relationship between ACVD and dyslipidemias in hemodialysis patients. A number of retrospective, cross-sectional studies found no relationship, or—in some cases—even paradoxical correlations between dyslipidemias and ACVD in hemodialysis patients (Table 10). However, there are a number of reasons that studies have failed to find a positive association between dyslipidemias and ACVD. None of these studies was a long-term, prospective, cohort study, and it is likely that illness, inflammation, and poor nutrition confounded the relationships between dyslipidemias and ACVD. Support for this notion comes from studies that have found that at least some of the seemingly paradoxical associations between dyslipidemias and ACVD are, in part, explained by statistical adjustment for markers of malnutrition and systemic inflammation.85–87
More than a decade ago, it was reported that the association between cholesterol and mortality (much of which was presumably due to CVD) in hemodialysis patients took the form of a U-shaped curve.85,86 Moreover, the association between low cholesterol and increased mortality was reduced after adjusting for levels of serum albumin.85,86 Similarly, in a recent prospective study of 1,167 hemodialysis patients, low serum cholesterol levels were associated with all-cause mortality in patients with low serum albumin.87 However, in patients with normal serum albumin, the opposite was true; high serum cholesterol predicted mortality.87 C-reactive protein, a marker of inflammation, has been associated with lower serum cholesterol levels.87 Other markers of inflammation, eg, interleukin-6 and tumor necrosis factor- , are also associated with low serum cholesterol levels in hemodialysis patients.88
Altogether, these data demonstrate a seemingly paradoxical association between low serum cholesterol and increased mortality in hemodialysis patients. They should not be interpreted to mean that dyslipidemias do not contribute to the pathogenesis of ACVD. Rather, it is more likely that the opposite is true, ie, that high cholesterol contributes to ACVD in hemodialysis patients as it does in the general population, and that other conditions accompanying low cholesterol (such as inflammation) account for the increased mortality of patients with low cholesterol.
Non-Traditional Lipid Abnormalities and ACVD in Hemodialysis Patients
Several observational studies have reported a positive association between lipoprotein(a) [Lp(a)] and ACVD in hemodialysis patients.18,90,91,93,96,98 In 4 of these studies, the association was statistically significant.18,91,93,98 Interestingly, apolipoprotein(a) low molecular weight phenotypes, which correlate with higher levels of Lp(a), were recently shown to be associated with ACVD in 440 hemodialysis patients.90 In contrast, a small study (n = 75) of peritoneal dialysis patients99 and a small study (n = 79) of transplant patients both failed to find an association between Lp(a) and ACVD. Although other studies have noted elevated Lp(a) in CKD patients as well,100,101 there are no studies in patients with CKD, or in the general population, examining the effect of reducing Lp(a) on CVD. Thus, it is difficult to recommend routine measurement of Lp(a) in clinical practice.
It is also possible that other, non-traditional, atherogenic lipoprotein abnormalities may cause or contribute to ACVD in hemodialysis patients. For example, some,102–105 but not all,106 case control studies examining oxidized lipoproteins in hemodialysis patients have reported higher levels compared to matched controls. In addition, a randomized, controlled trial found that supplementation with vitamin E reduced recurrent ACVD events in 196 hemodialysis patients (P = 0.014).107 However, this trial was small, and much larger trials in the general population have failed to show benefit from vitamin E supplementation.108–115
Evidence from observational studies in the general population has suggested that lipoprotein remnants may contribute to ACVD, especially in patients with high triglycerides.3 There are also cross-sectional studies reporting that hemodialysis patients have higher levels of remnant lipoproteins, eg, triglyceride-enriched lipoproteins and/or small dense LDL, compared to controls.104,116–123 However, none of these studies reported correlations between levels of remnant lipoproteins with ACVD, and the significance of these abnormalities is unknown.
Associations Between Dyslipidemias and ACVD in Peritoneal Dialysis Patients
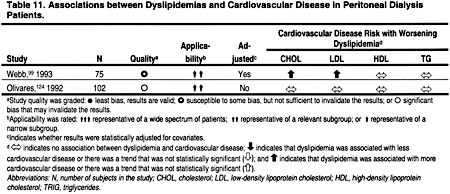
Only 2 studies that examined the relationship between dyslipidemias and ACVD in peritoneal dialysis patients were identified (Table 11). Both of these studies had major design limitations, and both were too small to rigorously examine the relationship between dyslipidemias and ACVD in the peritoneal dialysis patient population.
Associations Between Dyslipidemias and ACVD in Kidney Transplant Recipients
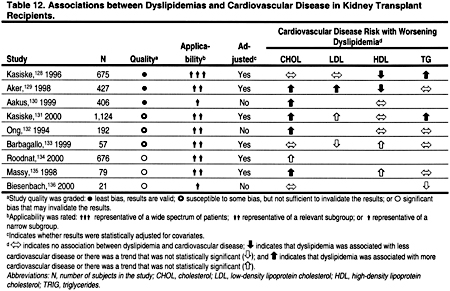
Several studies have reported a positive association between total cholesterol and ACVD in kidney transplant recipients (Table 12). Unfortunately, few of these studies examined the relationship between LDL and ACVD. Lower levels of HDL were associated with ACVD in 3 of 4 studies. In 3 of 6 studies, higher levels of triglycerides were associated with ACVD. Altogether these studies suggest that the relationship between ACVD and dyslipidemias in kidney transplant recipients is similar to that observed in the general population. However, each of these studies had design limitations; in particular, none was truly prospective. Kidney transplant recipients may also have non-traditional lipoprotein abnormalities that could theoretically contribute to ACVD.125–127 However, the role of these lipoprotein abnormalities in the pathogenesis of ACVD in CKD, as in the general population, is unclear.
The Evaluation of Dyslipidemias in CKD
Measurements of total cholesterol, HDL, and triglycerides are readily available in most major clinical laboratories. The LDL that forms the foundation for treatment decisions in the ATP III Guidelines3 is generally calculated from total cholesterol, HDL, and triglycerides using the Friedewald formula. The ATP III Guidelines also recommend treatment of some dyslipidemias that may occur with normal or low LDL. These dyslipidemias—often seen in association with the metabolic, or insulin resistance syndrome (the syndrome of obesity, hypertension, insulin resistance, and hyperlipidemia) and characterized by increases in circulating lipoprotein remnants—can be most readily measured as non-HDL cholesterol, ie, total cholesterol minus HDL (Fig 6).3 All of the major treatment decisions for dyslipidemia in these guidelines, as in the ATP III Guidelines, are based on levels of triglycerides, LDL, and non-HDL cholesterol.
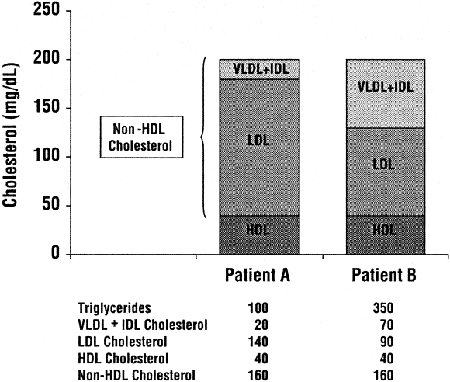
Fig 6. Example demonstrating the relative contributions of VLDL and IDL remnants to non-HDL cholesterol in two hypothetical patients with normal and high triglycerides, respectively. Although both patients A and B have the same total and HDL cholesterol levels, for patient A with normal triglycerides, most of the non-HDL cholesterol is LDL. However, for Patient B with high triglycerides, much of the non-HDL cholesterol is VLDL and IDL remnants. Units are in mg/dL. To convert mg/dL to mmol/L, multiply triglycerides by 0.01129 and total, LDL, HDL and non-HDL cholesterol by 0.02586. Abbreviations: VLDL, very low-density lipoproteins; IDL, intermediate density lipoproteins; LDL, low-density lipoproteins; HDL, high-density lipoproteins.
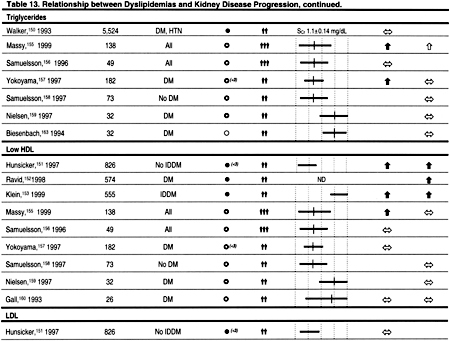
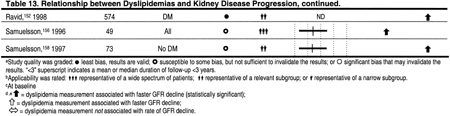
Associations Between Dyslipidemias and Kidney Disease Progression
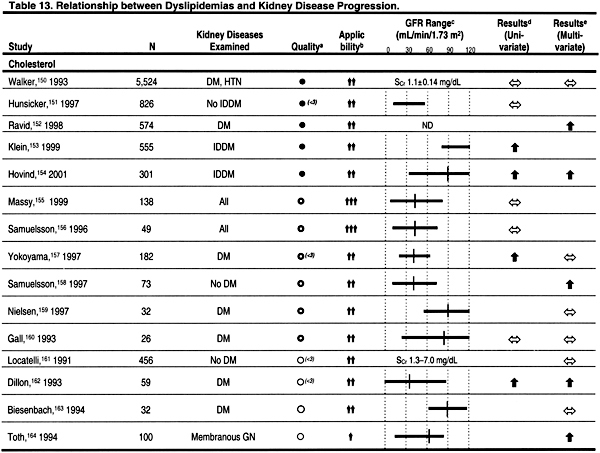
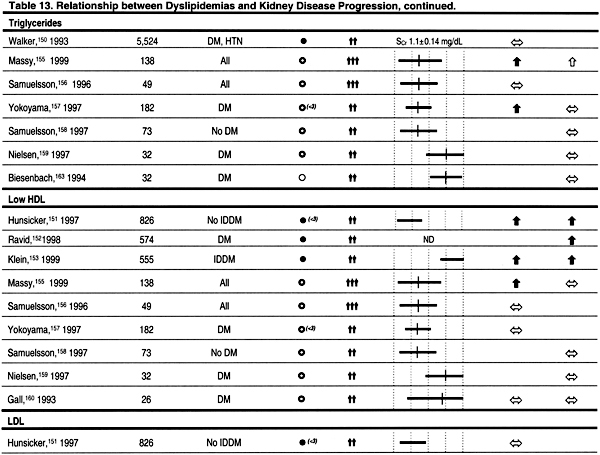
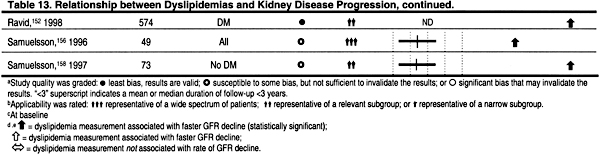
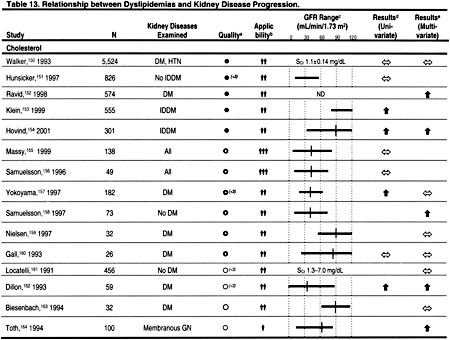
The principal reason to evaluate dyslipidemias in patients with CKD is to detect abnormalities that may be treated to reduce the incidence of ACVD. However, there may be other reasons to evaluate and treat dyslipidemias in CKD. A number of observational studies have reported that various dyslipidemias are associated with decreased kidney function in the general population and in patients with CKD (Table 13). It is impossible to determine from these studies whether dyslipidemias cause reduced kidney function, result from reduced kidney function, or whether other conditions such as proteinuria cause both reduced kidney function and dyslipidemias. Each of these explanations is plausible, and only randomized, controlled trials can adequately test the hypothesis that dyslipidemias cause a decline in kidney function.
Unfortunately, there are no large, adequately powered, randomized, controlled trials testing the hypothesis that treatment of dyslipidemia preserves kidney function. However, there have been several small studies,137–148 and a meta-analysis of these studies.149 This meta-analysis included prospective, controlled trials published before July 1, 1999. Three trials published only in abstract form were included in this meta-analysis137,138,148; one of these studies has subsequently been published in a peer-reviewed journal.148 All patients were followed for at least 3 months, but in only 5 studies were patients followed for at least 1 year. Statins were used in 10 studies, gemfibrozil in 1 study, and probucol in 1 study. Altogether, 362 patients with CKD were included in the meta-analysis. The results suggested that the rate of decline in GFR was significantly less in patients treated with a cholesterol-lowering agent compared to placebo.149 No significant heterogeneity in treatment effect was detected between the studies. However, the quality of the studies was generally low, and their small sample sizes and relatively short duration of follow-up make it difficult to conclude that lipid-lowering therapies reduce the rate of decline in GFR in CKD. Therefore, the primary or secondary prevention of ACVD remains the principal reason to evaluate and treat dyslipidemias in patients with CKD.
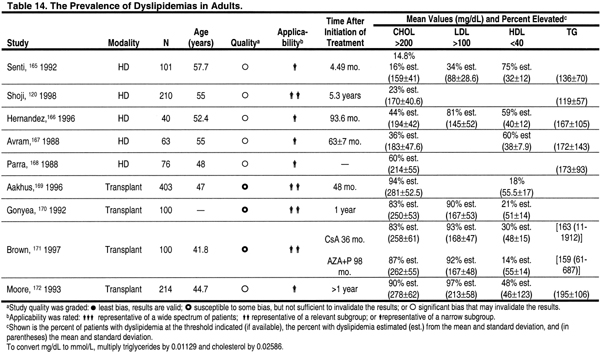
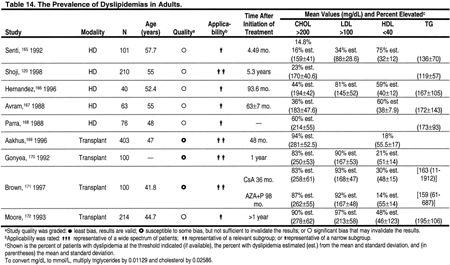
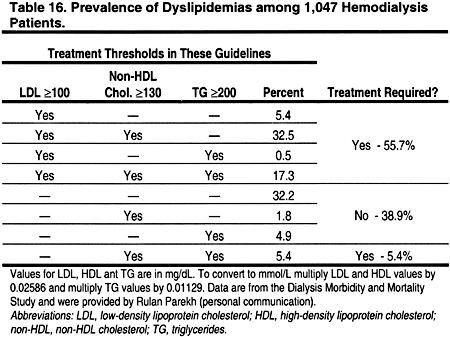
The Prevalence of Dyslipidemias in Hemodialysis Patients
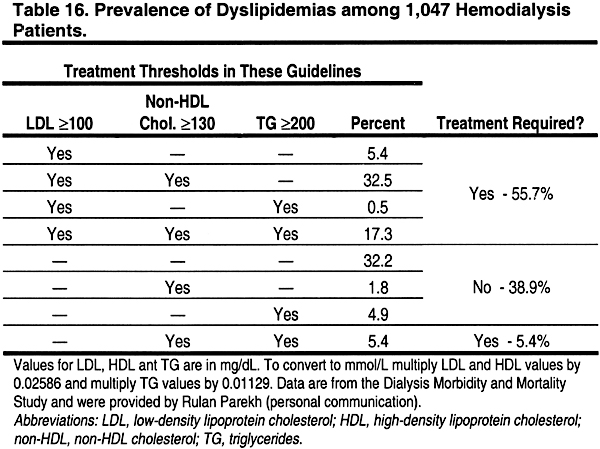
The prevalence of dyslipidemias in patients with CKD is high (Tables 14, 15, 16, and 17). Dyslipidemias in hemodialysis patients are most often characterized by normal LDL, low HDL, and high triglycerides. From the published literature, it is difficult to discern the prevalence of dyslipidemia in hemodialysis patients, since most studies are relatively small and use varying definitions for dyslipidemia. Therefore, the Work Group examined the prevalence of dyslipidemia in a large cross-section of 1,047 hemodialysis patients in the Dialysis Morbidity and Mortality Study (Table 16). The definitions of the ATP III Guidelines, as well as those adopted in these guidelines, were used. According to ATP III definitions, only 20.2% of hemodialysis patients had normal lipid levels, ie, LDL <130 mg/dL (<3.36 mmol/L), HDL >40 mg/dL (>1.03 mmol/L), and triglycerides <150 mg/dL (<1.69 mmol/L). Using the definitions of the present guidelines, 61.1% would require treatment of a dyslipidemia; 55.7% would require treatment based on LDL ≥100 mg/dL (≥2.59 mmol/L), while another 5.4% with normal LDL would require treatment based on triglycerides ≥200 mg/dL (≥2.26 mmol/L) and non-HDL cholesterol ≥130 mg/dL (≥3.36 mmol/L) (Table 16).
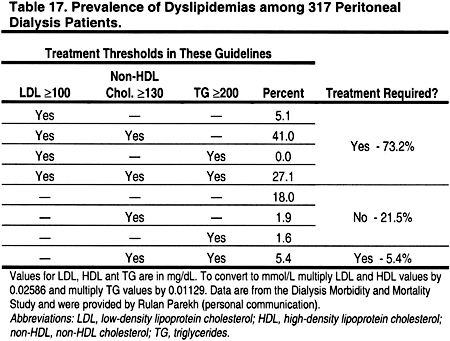
The Prevalence of Dyslipidemias in Peritoneal Dialysis Patients
The prevalence of dyslipidemia in patients treated with peritoneal dialysis is high, and differs somewhat from that in hemodialysis patients (Tables 14, 15, 16, and 17). In a cross-section of 317 peritoneal dialysis patients from the Dialysis Morbidity and Mortality Study (Table 17), only 15.1% had normal lipid levels according to the ATP III Guidelines, ie, LDL <130 mg/dL (<3.36 mmol/L), HDL >40 mg/dL (>1.03 mmol/L), and triglycerides <150 mg/dL (<1.69 mmol/L). Using the definitions of the present guidelines, 78.6% would require treatment of a dyslipidemia; 73.2% would require treatment based on LDL ≥100 mg/dL (≥2.59 mmol/L), while another 5.4% with normal LDL would require treatment based on triglycerides ≥200 mg/dL (≥2.26 mmol/L) and non-HDL cholesterol ≥130 mg/dL (≥3.36 mmol/L) (Table 17).
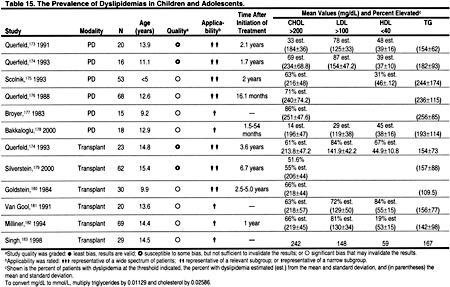
The Prevalence of Dyslipidemias in Kidney Transplant Recipients
The prevalence of dyslipidemias in kidney transplant recipients is very high (Table 14 and Table 15). Particularly common are increases in total cholesterol and LDL. Triglycerides are often increased, but HDL is usually normal.
The Frequency of Dyslipidemia Evaluation in CKD
Many factors influence the prevalence of dyslipidemias in CKD. Changes in proteinuria, GFR, and treatment of CKD may alter lipoprotein levels. Therefore, it is prudent to evaluate dyslipidemias more often than is recommended in the general population. Lipoprotein levels may change during the first 3 months of hemodialysis, peritoneal dialysis, and kidney transplantation. On the other hand, waiting 3 months to measure the first lipid profile may needlessly delay effective treatment for patients who present with dyslipidemia. For patients whose lipid profile is normal at presentation, it is reasonable to repeat the lipid profile 3 months later, to confirm that the initial values were not low due to malnutrition or systemic disease. During the course of kidney disease treatment, lipid levels may change. Therefore, the Work Group recommends measuring subsequent levels at least annually. Reasons to repeat lipid measurements after 2–3 months include changes in kidney replacement therapy modality, treatment with diet or lipid-lowering agents, immunosuppressive agents that affect lipids (eg, prednisone, cyclosporine, or sirolimus) or other changes that may affect plasma lipids.

Dyslipidemias in Adolescents
Young adults (20–40 years old) with Stage 5 CKD have at least a 10-fold higher risk for CVD mortality compared to the general population.184 There are limited data on ACVD in children with CKD. However, CVD accounts for approximately 23% of deaths in children and adults <30 years old who started treatment for stage 5 CKD as children.185 Recent data from the Pathobiological Determinants of Atherosclerosis in Youth (PDAY) study provide compelling evidence in the general pediatric population, that initial fatty streaks seen in adolescents develop into atheromatous plaques in young adults.186 Moreover, this atherosclerotic process is believed to be accelerated in uremia, thus putting children with Stage 5 CKD at high risk for developing ACVD. Indeed, studies of arteries from children with Stage 5 CKD have demonstrated early ACVD changes.187,188
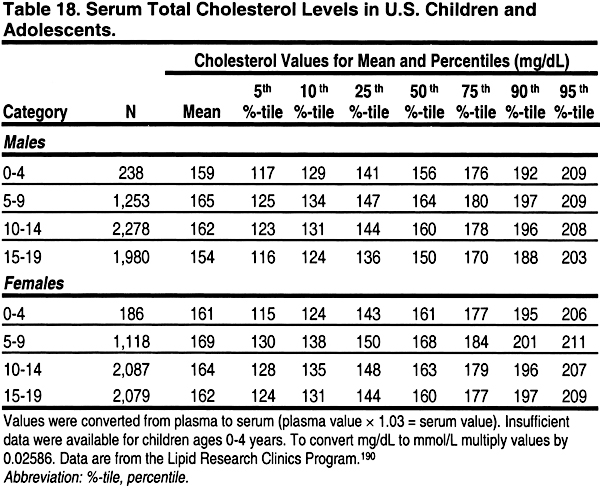
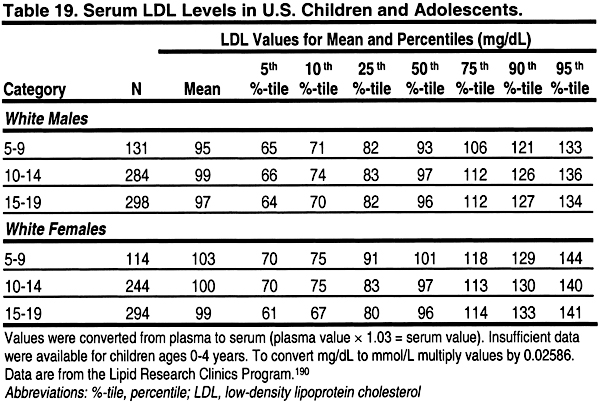
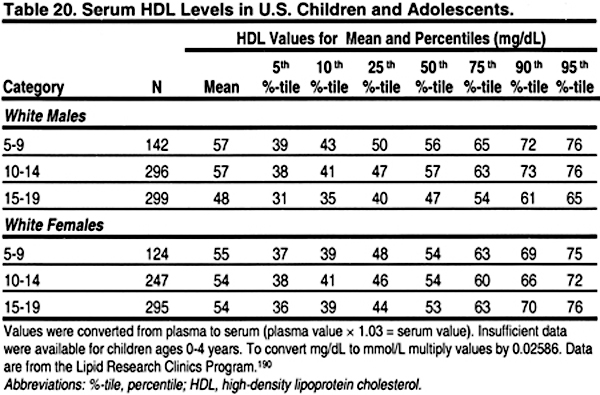
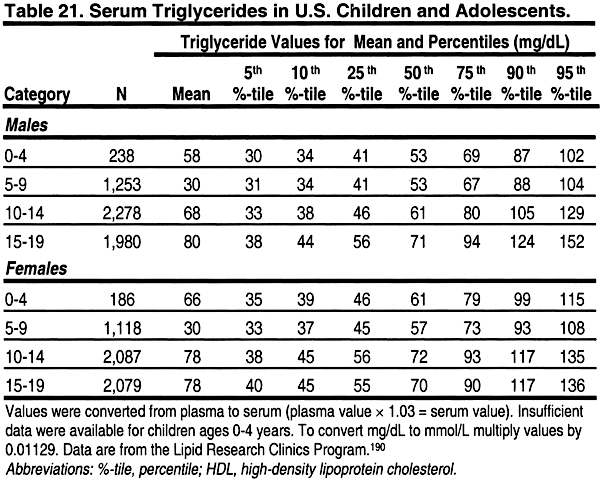
It is important to note that lipid levels in the general population change with age and puberty, and differ by gender (Tables 18, 19, 20, and 21). 189 Very low levels at birth increase rapidly in the first year of life to a mean total cholesterol of 150 mg/dL (3.88 mmol/L), LDL 100 mg/dL (2.59 mmol/L), and HDL 55 mg/dL (1.42 mmol/L).


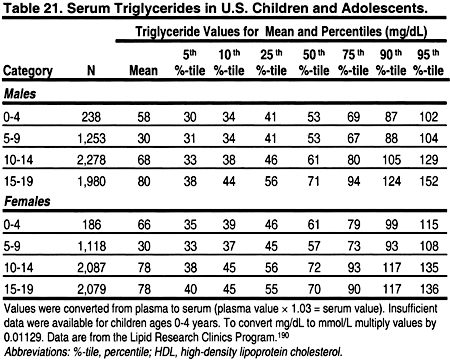
From ages 1–12, lipid levels remain fairly constant, and are slightly lower in girls than boys. During puberty, there is a decrease in total cholesterol, LDL, and a slight decrease in HDL in boys. After puberty, ie, by age 17, cholesterol and LDL increase to adult levels in boys and girls. Boys continue to have a slightly lower HDL than girls. These changes dictate that the definitions of dyslipidemias be different in children and adults. These guidelines define dyslipidemias for children using lipid levels greater than the 95 percentile for age and gender (Tables 18, 19, 20, and 21). Treatment thresholds for children do not differ by age and gender, but these thresholds are different from those of adults.
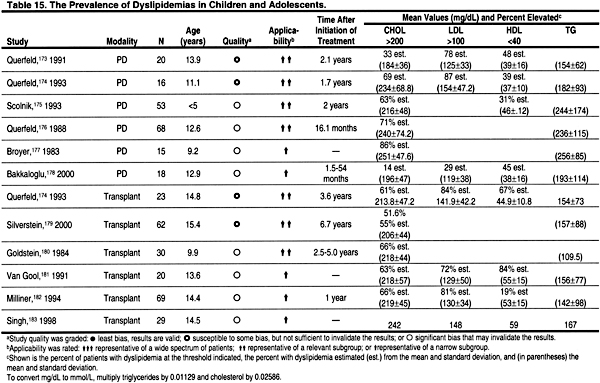
There are few data documenting the prevalence of dyslipidemias in children and adolescents with CKD. A search was conducted for studies published after 1980 that included at least 15 patients and reported data on the prevalence of dyslipidemia in unselected patients with CKD. There were no studies of hemodialysis patients. Children and adolescents on peritoneal dialysis appeared to have a very high prevalence of dyslipidemias (Table 15). Indeed, 29% to 87% of pediatric peritoneal dialysis patients had LDL >100 mg/dL (>2.59 mmol/L). Similarly, 72% to 84% of pediatric kidney transplant recipients had LDL >100 mg/dL (>2.59 mmol/L) (Table 15). In a longitudinal study of pediatric transplant patients, the prevalence of hypercholesterolemia declined from 70.4% to 35% at 10 years, with a decrease in hypertriglyceridemia from 46.3% to 15%.182 This decline in prevalence may reflect reductions in immunosuppressive medications and improved kidney function. Unfortunately, no longitudinal studies have defined the long-term risk of dyslipidemias in children with CKD, particularly as they survive into young adulthood.
Use of the Friedewald Formula to Calculate LDL
The Friedewald formula appears to be the most practical, reliable method for determining LDL cholesterol in clinical practice: LDL=Cholesterol–HDL–(triglycerides÷5),in mg/dL, or LDL=Cholesterol–HDL–(triglycerides÷2.19),in mmol/L.191
Two recent studies found the Friedewald formula to be reliable in dialysis patients,192,193 although other investigators reported that the percentage error for the formula is higher in patients with CKD compared to the general population.194 No studies have examined the accuracy of the Friedewald formula in transplant recipients, or studies in other CKD patients, eg, those with nephrotic syndrome.
Recent data from a study in the general population suggest that the Friedewald formula may underestimate LDL in patients with low LDL levels.31 Data from the general population also suggest that the Friedewald formula is not accurate when triglycerides are ≥400 mg/dL (≥4.52 mmol/L). Direct measurement of LDL with ultra-centrifugation or immunoprecipitation techniques is reasonably accurate when triglycerides are 400–800 mg/dL (4.52–9.03 mmol/L), but there are no reliable techniques for determining LDL when triglycerides are ≥800 mg/dL (≥9.03 mmol/L). Fasting triglycerides ≥800 mg/dL (≥9.03 mmol/L) generally indicate the presence of hyperchylomicronemia, and the role of hyperchylomicronemia in ACVD is unknown.
There are few studies in children, and none included children with CKD. However, in 1 study of children from the general population, calculating LDL using the Friedewald formula was more reliable in correctly classifying patients with high LDL than was the direct measurement of LDL.195
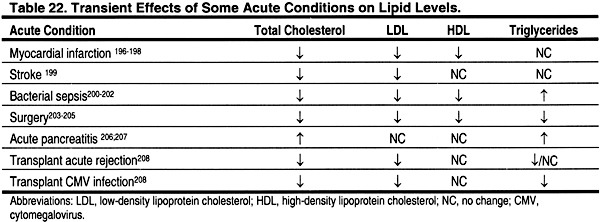
Dyslipidemias in Acute Medical Conditions
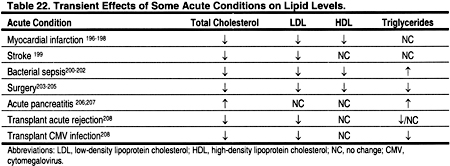
Some acute medical conditions may transiently alter plasma lipid levels (Table 22). For example, severe infections, surgery and acute myocardial infarction are often associated with lower-than-normal lipid levels. Other conditions, for example acute pancreatitis, may be associated with higher levels. In general, it is best to wait until acute conditions that may alter lipid levels have resolved before assessing dyslipidemias for possible ACVD risk. It should be noted, however, that the lipid profile is not significantly altered within the first 24 hours after a myocardial infarction, and a lipid profile can be measured during this time.196–198
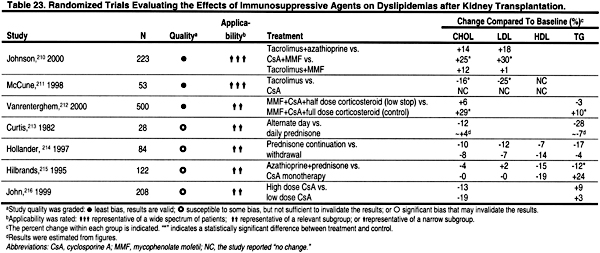
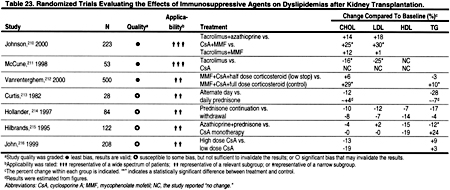
The Influence of Immunosuppressive Agents
Immunosuppressive medications, eg, prednisone, cyclosporine, and sirolimus are among the several potential remediable causes of dyslipidemias in patients with CKD and after kidney transplantation (Table 23). It is not clear how soon these agents exert their effects on lipoprotein metabolism, and when lipid levels reach a new steady state. However, the effects of diet and lipid-lowering agents may not be fully manifest for 2–3 months, and—by analogy—it may be best to measure a lipid profile 2–3 months after starting or stopping an immunosuppressive agent that is known to have a major effect on lipoprotein levels, eg, prednisone, cyclosporine, or sirolimus.
The present guidelines are consistent with those of the American Society of Transplantation (AST), which recommend that a lipid profile should be measured during the first 6 months post-transplant, at 1 year after transplantation, and annually thereafter.209 The AST guidelines also suggest that changes in immunosuppressive therapy, graft function, or CVD risk warrant additional testing.209
Guideline 2
2.1.For adults and adolescents with Stage 5 CKD, a complete lipid profile should be measured after an overnight fast whenever possible. (B)
2.2.Hemodialysis patients should have lipid profiles measured either before dialysis, or on days not receiving dialysis. (B)
Fasting
Eating raises plasma triglycerides, carried mostly in chylomicrons and very low-density lipoprotein (VLDL), and, as a result, total cholesterol levels also increase. The post-prandial increases in triglycerides and cholesterol are quite variable, depending on the type of food ingested. In addition, substantial variability in post-prandial lipid levels is attributable to inherited and acquired differences between individuals. Although these differences affect the risk for ACVD, the relationship between post-prandial lipid levels and ACVD is not as well established as the relationship between fasting lipid levels and ACVD.3 Practical considerations may make non-fasting measurements the only alternative for some patients. While fasting lipid profiles are best, it is better to obtain non-fasting lipid profiles than to forgo evaluation altogether. If the lipid profile obtained in a non-fasting patient is normal, then no further assessment is needed at that time. However, an abnormal lipid profile in a non-fasting patient is an indication to obtain a fasting lipid profile.
Effects of Hemodialysis and Peritoneal Dialysis on Plasma Lipids
There is some evidence that the hemodialysis procedure acutely alters plasma lipid levels.217 This may be due to hemoconcentration and/or effects of the dialysis membrane or heparin on lipoprotein metabolism. Therefore, assessment should be done prior to the hemodialysis procedure. There are few data describing how quickly lipoprotein levels change during the course of peritoneal dialysis exchanges. However, it is probably most practical to draw blood in the morning, after an overnight fast (whenever possible), and with whatever peritoneal dialysis fluid is dwelling in the peritoneal cavity when the blood is drawn.
Guideline 3
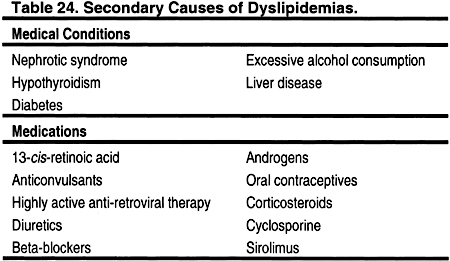
Stage 5 CKD patients with dyslipidemias should be evaluated for remediable, secondary causes. (B)
Rationale
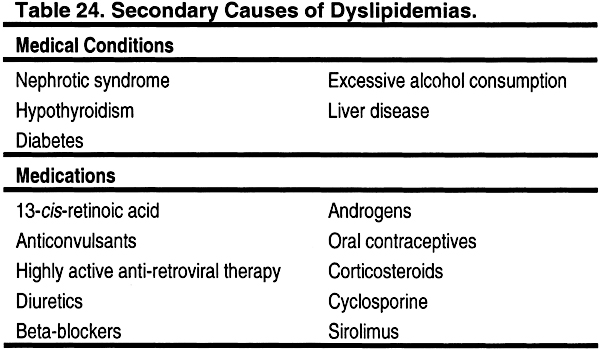
Causes of secondary dyslipidemias include nephrotic syndrome,218–223 hypothyroidism,224–226 diabetes,227–229 excessive alcohol ingestion,230–234 and chronic liver disease (Table 24). 235–237 Medications that can cause dyslipidemias include 13-cis-retinoic acid,238–240 anticonvulsants,241–243 highly active anti-retroviral therapy,244–246 beta-blockers,247 diuretics,247 androgens/anabolic steroids,248–251oral contraceptives,252–254 corticosteroids,212,255,256 cyclosporine,210,215,257 and sirolimus258,259 (Table 24). The assessment of these secondary causes with history, physical examination, and appropriate laboratory testing is recommended for any patient with dyslipidemia, since effective correction of these disorders may improve the lipid profile.
Urine protein excretion, especially if >3 g per 24 hours, can also cause or contribute to dyslipidemias.218–223 Therefore, CKD patients who still produce urine should have protein excretion measured, if this has not been done recently. In some cases, the underlying cause(s) of the proteinuria can be treated and effectively reversed. In other cases, angiotensin II converting enzyme inhibitors or angiotensin II receptor blockers may help reduce protein excretion, and may thereby improve the lipid profile in some patients. Clinical hypothyroidism can cause dyslipidemia,224–226 and even subclinical hypothyroidism may cause mild changes.225,260 Some of the signs and symptoms of hypothyroidism may resemble those of uremia, which may make the clinical diagnosis of hypothyroidism more difficult in patients with CKD. Glucose intolerance can also cause dyslipidemias.227–229 Therefore, patients with dyslipidemia and CKD (but without known diabetes) should be assessed with fasting blood glucose and possibly glycosylated hemoglobin. Glycemic control can improve lipid profiles.
Secondary causes of dyslipidemia in children and adolescents, in addition to those listed in Table 24, include lipodystrophy261,262; idiopathic hypercalcemia263,264; glycogen storage diseases265–268; cystine storage disease; Gaucher disease; Juvenile Tay-Sachs disease; Niemann-Pick Disease; sphingolipidoses; obstructive liver disease such as biliary atresia269,270; biliary cirrhosis; intrahepatic cholestasis; nephrotic syndrome; anorexia nervosa271,272; progeria273,274; systemic lupus erythematosus275,276; Werner syndrome; and Klinefelter syndrome. These conditions are fortunately rare, and require referral to appropriate tertiary care specialists.