
The reader is referred to previously published guidelines and to the works of primary investigators in the field for a more in-depth explanation of urea modeling and kinetics. The DOQI Nutrition Work Group endorses the previous DOQI recommendations concerning Kt/V and offers new material concerning eKt/V and a new recommendation for the normalization of PNA (nPNA). The Work Group recognizes that dialysis units may use a variety of methods for determining Kt/V and nPNA. These may range from the use of previously published nomograms and simple, noniterative formulas to the use of iterative urea kinetic modeling. The Work Group does not propose that one method is superior to another, but only that the formulas listed in this Appendix are preferable for the uses indicated. The term nPNA will be substituted for normalized protein catabolic rate (nPCR) when the latter term was used in earlier equations and published reports.
The results of the National Cooperative Dialysis Study (NCDS) led to a mechanistic analysis of dialysis adequacy based on solute clearance.243 Two important concepts emerged from these analyses: urea clearance (a measure of dialysis dose not related to protein catabolism) and nPNA (a measure of protein nitrogen appearance unrelated to dialysis dose). Some have pointed out that Kt/V and nPNA may be mathematically interrelated, because they share some common parameters.244 Potential causes of coupling including error coupling, calculation bias, and confounding variables.244 Certain study designs are sensitive to specific errors due to these types of mathematical coupling. For example, cross-sectional studies may suffer from all three types of errors. Nonrandomized longitudinal studies may be affected by calculation bias and confounding variables; and randomized, prospective trials are subject to calculation bias. The prospective, randomized HEMO trial should help to determine the physiological relationship between Kt/V and nPNA.244 Current data suggest that there is little relationship clinically between Kt/V and nPNA.245 nPCR did not differ between the Kt/V = 1.0 and Kt/V = 1.4 groups, but did increase with a higher protein diet group (1.3 versus 0.9 g/kg/d). The presence of these three types of error in the determination and interpretation of Kt/V and nPNA must be recognized by the clinician if Kt/V and nPNA are to be correctly interpreted.
nPNA may be affected by protein intake, by anabolic and catabolic factors such as corticosteroids or anabolic hormones, and possibly by other factors that are currently unrecognized. nPNA is closely correlated with DPI only in the steady state; ie, when protein and energy intake are relatively constant (< 10% variance), when there are little or no internal or external stressors, when there is no recent onset or cessation of anabolic hormones, and, when calculated by the two-BUN method, the dose of dialysis is constant. In the individual patient who is in a stable steady-state and who has none of the previously mentioned conditions that would interfere with the interpretation of the nPNA, it may be reasonable to assume that nPNA reflects the DPI. As has been done in the HEMO study, it is advisable to independently check the DPI (derived from nPNA) by intermittently obtaining dietary histories.
The terminology for PCR has recently been questioned. It has been argued that, although it represented a useful concept, it was a misnomer, because intact proteins, peptides, and amino acids are lost in dialysate and urine and are not catabolized. Moreover, protein catabolism in nutrition and metabolic literature refers to the absolute rate of protein breakdown that commonly requires measurement of isotopically labeled amino acids. The absolute rate of protein breakdown is much greater than the net degradation of exogenous and endogenous proteins that result in urea excretion.63 Instead of PCR, the term "protein equivalent of total nitrogen appearance" (PNA) has been suggested,63 which is in keeping with the original definition suggested by Borah et al.137 The DOQI Nutrition Work Group prefers the use of PNA instead of PCR and recommends its acceptance by the dialysis community, because it is more precise and is a term that better reflects the actual physiology.
PNA may be normalized (nPNA) to allow comparison among patients over a wide range of body sizes. The most convenient index of size is the urea distribution volume (V), because it is calculated from urea modeling, is equivalent to body water volume, and is highly correlated with fat free or lean body mass. Total body weight is a poor index of PNA because nitrogen appearance is not affected by body fat. However, because V is an index that is unfamiliar to clinicians and not readily available, it is customary to convert V to a normalized body weight by dividing by 0.58, its average fraction of total body weight. The resulting nPNA is expressed as the equivalent number of grams of protein per kilogram of body weight per day, but it is important to note that body weight in the denominator is not the patient's actual body weight but instead is an idealized or normalized weight calculated from V/0.58. For example, to calculate DPI (for a patient who satisfies the previously discussed criteria for steady state), one must not multiply nPNA by the patient's actual body weight but instead multiply by V/0.58.
The Work Group believes that ideal body weight (aBWef), which correlates very closely with body water volume, is a good denominator for normalizing PNA. Ideal weight may be more appropriate than V/0.58 in patients who are emaciated or edematous. Like many physiologic variables, PNA may correlate better with body surface area, but because water volume is highly correlated with surface area within the range of adult body sizes, urea volume is a reasonable substitute.
The methods used to determine the PNA (PCR) differ between maintenance hemodialysis and chronic peritoneal dialysis because of the differences in calculating total nitrogen appearance (TNA). TNA is the sum of all outputs of nitrogen from the body including skin, feces, urine, and dialysate. The technique for the measurement of TNA is expensive, labor intensive, and impractical for routine clinical use. In metabolically stable patients, the nitrogen output in feces (including flatus) and skin (including nails and hair) is constant and can be ignored for the sake of simplifying the calculation. The TNA is very strongly correlated with UNA.137,150,246-248 Although this correlation is strong, the 95% confidence limits are ±20% of the mean.249 The regression equations used to estimate TNA from UNA may not be accurate if a patient has unusually large protein losses into dialysate, has high urinary ammonium excretion, or is in marked positive or negative nitrogen balance.63
The formulas used to calculate the single-pool Kt/V (spKt/V) and PNA (PCR) can be divided into two separate groupings: those that depend on a three-BUN measurement, single-pool, variable-volume kinetic model and those that depend on a two-BUN measurement, single-pool, variable-volume model.
The two-BUN method is more complex than the three-BUN method, because it requires computer iteration over an entire week of dialysis to arrive at G (urea generation rate). The three-BUN method calculates the urea generation rate (G) from the end of the first dialysis to the beginning of the second dialysis and is primarily determined by the difference between the two-BUN values (post- to pre-). It also requires iteration and a computer but only over the time span of a single dialysis and a single interdialysis interval. The two-BUN method calculates G from the absolute value of the predialysis BUN (C0) and Kt/V. Because C0 is determined both by G and by Kt/V, if Kt/V is known (calculated from the fall in BUN during dialysis), then G can be determined from the absolute value of C0 (by the complicated iteration scheme over an entire week). Note that the absolute value of C0 is not used to calculate Kt/V, which is determined by the log ratio of C0/C. Comparing the two methods, although the three-BUN method is mathematically simpler, it is actually more difficult to do because it requires waiting 48 to 72 hours before the third BUN can be drawn. It is also a more narrow measure of G because it is constrained to the single interdialysis period and can be manipulated by the patient who becomes aware that the measurement will be done when the first two blood samples are drawn. Fortunately, graphical nomograms have been developed and validated that allow the calculation of PNA based on predialysis and postdialysis BUN samples from the same dialysis session.250
Equations for the Determination of spKt/V, V, and PNA (PCR) in HD and Peritoneal Dialysis Patients
Hemodialysis. Two-BUN, single-pool, variable-volume model:


where C0 is the predialysis BUN. C0 is adjusted upward in patients who have significant remaining GFR according to the formula:

Kr is residual urinary urea clearance in mL/min, C0' and C0 are in mg/dL, and V is in L. Because these formulas introduce errors ranging from 3.7% (end of week) to 8.39% (beginning of week) and the r ranges from 0.9982 to 0.9930, the Work Group believes that they represent an excellent approach to the simplified measurement of PNA (PCR).
The DOQI Hemodialysis Adequacy Work Group has recommended the use of the natural log formula to calculate Kt/V:

where R is the postdialysis/predialysis BUN ratio, t is the dialysis session in hours, UF is the ultrafiltration volume in liters, and W is the postdialysis weight in kilograms.251 Multiple errors can occur that will affect the calculated PCR, Kt/V, and UNA. To decrease errors in the timing of the collection of BUN and to standardize the measurement, the BUN should be drawn using the Stop Flow/Stop Pump technique recommended by the DOQI Hemodialysis Adequacy Work Group. A complete discussion of the sampling techniques, problems, and trouble shooting can be found in the Clinical Practice Guidelines.252,253
The DOQI Hemodialysis Adequacy Work Group has recommended the following formulas for UKM using a single pool, three-sample model. These should be determined using already available computer software and should be utilized by those dialysis units that have formal UKM available to them. These formulas assume thrice-weekly HD.

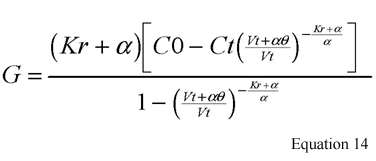
where Vt is the postdialysis volume; Qf is the rate of volume contraction during dialysis (difference in pre and post weights divided by length of dialysis); G is the interdialytic urea generation rate (PNA); K and Kr are the dialyzer and renal urea clearances; Ct and C0 are the BUN concentrations at the end and beginning of dialysis; a is the rate of interdialytic volume expansion and it is calculated by the total IDWG divided by the length of the interdialytic period (theta); and C0' is the predialysis BUN of the subsequent dialysis session. An initial estimate of Vt is obtained from the use of an anthropometric or regression formula found in the Clinical Practice Guidelines.254
It is important to recognize that spKt/V overestimates the actual delivered dose of dialysis because of urea disequilibrium. The spKt/V actually measures the dialyzer removal of urea, not the actual patient clearance of urea. As dialysis time is shortened and the intensity of dialysis increases, the error in the estimation of the delivered dose of dialysis increases, because the effects of urea equilibrium are accentuated. Urea disequilibrium may occur because of diffusion disequilibrium between body water compartments (membrane dependent), flow disequilibrium because of differences of blood flow in various tissues and organs, and disequilibrium caused by cardio-pulmonary recirculation of blood. The latter type of disequilibrium is only seen in patients undergoing arterio-venous hemodialysis and not those undergoing veno-venous HD. Membrane, flow, and recirculation disequilibrium errors are magnified as dialysis time is shortened and the intensity of the session increased (eg, increasing Qb). For these reasons, a more accurate description of the delivered dose of dialysis has been developed that uses the equilibrated postdialysis BUN and bypasses the necessity of keeping the patient in the dialysis unit for an hour to obtain the true equilibrated postdialysis BUN sample.255 The work group recommends that this measurement of the effective patient clearance of urea (eKt/V) be utilized instead of spKt/V.

where K/V is expressed in hours-1.

Peritoneal dialysis. The formulas for calculation of PNA (PCR) in CPD patients have been validated for CAPD. However, they are generally applied to all CPD patients. In CPD patients the following formulas apply (yielding grams per 24 hours):
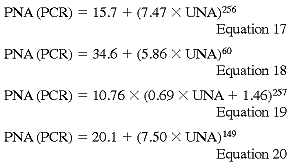
The UNA is calculated by measuring the 24-hour urea excretion by peritoneal dialysate and residual renal urea excretion and adding the change in total body urea nitrogen (calculated as BUN change over time):

where Vd and Vu are dialysate and urine volumes in L, t is the time of collection, and DUN and UUN are dialysate and urine concentrations of urea nitrogen. Because daily changes in daily BUN in CPD patients are negligible, the formula can be shortened to

Normalization of PNA for HD and Peritoneal Dialysis Patients
The PNA should be normalized or adjusted to a specific body size. The most common normalization and the one recommended by the DOQI Hemodialysis Work Group is to normalize to V/0.58251:

There are no data to support other normalization techniques, but normalization to edema-free aBW (aBWef) may be the preferred normalization technique.63 The DOQI Nutrition Work Group recommends the use of the following normalization formula (Guideline 12):

where aBWef is the actual edema-free body weight.
Calculation of V 252
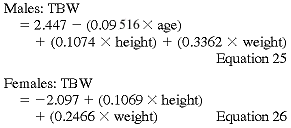
Anthropometric determination of urea distribution volume.
Hume-Weyer formula:
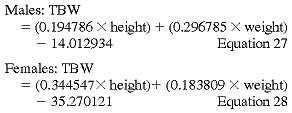
where TBW = total body water (V).
The Watson and Hume-Weyer formulas were derived from analyses of healthy individuals and their applicability to ESRD patients has been questioned. When compared with TBW calculated by BIA, the TBWs calculated from these formulas underestimate TBW by about 7.5%.
TBW by BIA Formula
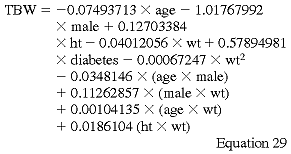
where wt and ht represent the patient's weight and height and male = 1 and diabetes = 1. If not male or not diabetic, then these values = 0.258