Prospective surveillance of fistulae and grafts for hemodynamically significant stenosis, when combined with correction of the anatomic stenosis, may improve patency rates and may decrease the incidence of thrombosis.
The Work Group recommends an organized monitoring/surveillance approach with regular assessment of clinical parameters of the AV access and HD adequacy. Data from the clinical assessment and HD adequacy measurements should be collected and maintained for each patient's access and made available to all staff. The data should be tabulated and tracked within each HD center as part of a Quality Assurance (QA)/CQI program.
4.1 Physical examination (monitoring):
Physical examination should be used to detect dysfunction in fistulae and grafts at least monthly by a qualified individual. (B)4.2 Surveillance of grafts:
Techniques, not mutually exclusive, that may be used in surveillance for stenosis in grafts include:
- 4.2.1 Preferred:
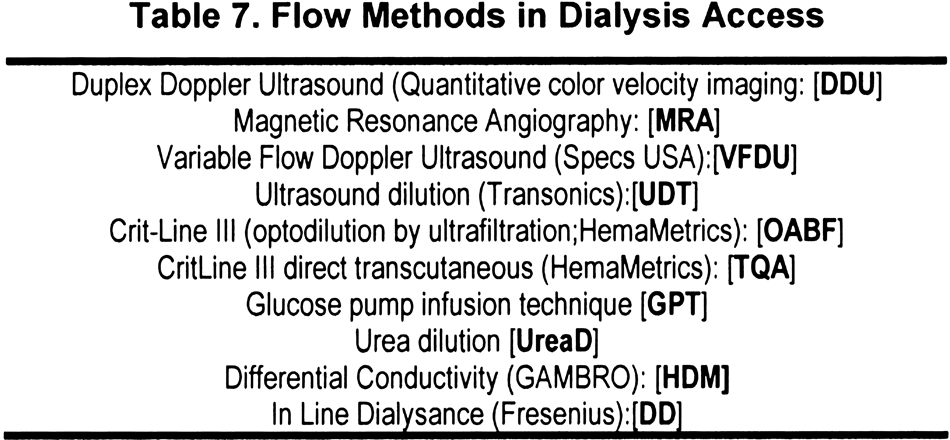
- 4.2.1.1 Intra-access flow by using 1 of several methods that are outlined in Table 7 using sequential measurements with trend analysis. (A)
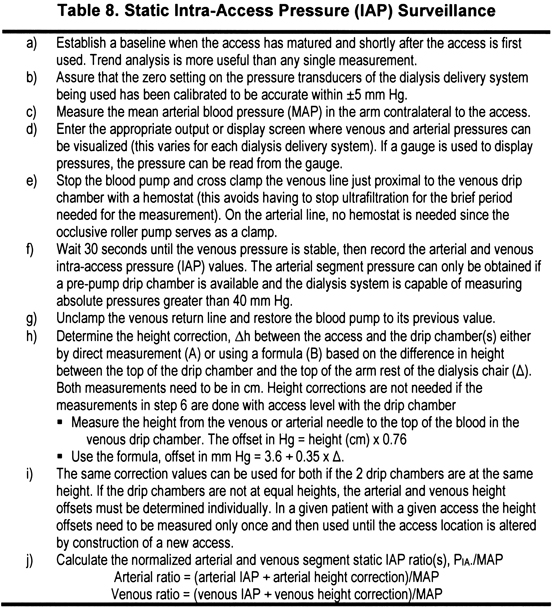
- 4.2.1.2 Directly measured or derived static venous dialysis pressure by 1 of several methods. (A) (Protocol provided in Table 8 for using transducers on HD machines to measure directly; criteria in Table 9 for derived methods.)
- 4.2.1.3 Duplex ultrasound. (A)
- 4.2.2 Acceptable:
- 4.2.2.1 Physical findings of persistent swelling of the arm, presence of collateral veins, prolonged bleeding after needle withdrawal, or altered characteristics of pulse or thrill in a graft. (B)
- 4.2.3 Unacceptable:
- 4.2.3.1 Unstandardized dynamic venous pressures (DVPs) should not be used.
4.3 Surveillance in fistulae:
Techniques, not mutually exclusive, that may be used in surveillance for stenosis in AVFs include:
- 4.3.1 Preferred:
- 4.3.1.1 Direct flow measurements. (A)
- 4.3.1.2 Physical findings of persistent swelling of the arm, presence of collateral veins, prolonged bleeding after needle withdrawal, or altered characteristics of pulse or thrill in the outflow vein. (B)
- 4.3.1.3 Duplex ultrasound. (A)
- 4.3.2 Acceptable:
- 4.3.2.1 Recirculation using a non–urea-based dilutional method. (B)
- 4.3.2.2 Static pressures (B), direct or derived. (B
4.4 When to refer for evaluation (diagnosis) and treatment:
- 4.4.1 One should not respond to a single isolated abnormal value. With all techniques, prospective trend analysis of the test parameter has greater power to detect dysfunction than isolated values alone. (A)
- 4.4.2 Persistent abnormalities in any of the monitoring or surveillance parameters should prompt referral for access imaging. (A)
- 4.4.3 An access flow rate less than 600 mL/min in grafts and less than 400 to 500 mL/min in fistulae. (A)
- 4.4.4 A venous segment static pressure (mean pressures) ratio greater than 0.5 in grafts or fistulae. (A)
- 4.4.5 An arterial segment static pressure ratio greater than 0.75 in grafts. (A)
Definitions
The following terms will apply to HD vascular access
Monitoring—the examination and evaluation of the vascular access by means of physical examination to detect physical signs that suggest the presence of dysfunction.
Surveillance—the periodic evaluation of the vascular access by using tests that may involve special instrumentation and for which an abnormal test result suggests the presence of dysfunction.
Diagnostic testing—specialized testing that is prompted by some abnormality or other medical indication and that is undertaken to diagnose the cause of the vascular access dysfunction.
Purpose of Access Surveillance
Vascular access function and patency are essential for optimal management of HD patients. Low BFRs and loss of patency limit HD delivery, extend treatment times, and, in too many cases, result in underdialysis that leads to increased morbidity and mortality.248 Between 1991 and 2001, the incidence of vascular access events in patients undergoing HD increased by 22%.249 In long-term AV accesses, especially grafts, thrombosis is the leading cause of loss of vascular access patency. Thrombosis increases health care spending7,250 and adversely affects QOL,162,250-253 and vascular access–related complications account for 15% to 20% of hospitalizations among patients with CKD stage 5 undergoing HD.7,12,252 Prevention of access dysfunction by maintaining adequate flow and preventing thrombosis translates into a policy of “Dialysis Dose Protection.” (See the KDOQI HD Adequacy Guidelines.) It is not feasible for any one individual to manage all aspects of access care. Multidisciplinary teams should be formed at each HD center,254-256 with a VAT coordinator, if possible. Whatever the team's size and composition, its most important function is to work proactively to ensure the patient is receiving an adequate dialysis dose by maintaining access function and patency.
The basic tenet for vascular access monitoring and surveillance is that stenoses develop over variable intervals in the great majority of vascular accesses and, if detected and corrected, underdialysis can be minimized or avoided (dialysis dose protection) and the rate of thrombosis can be reduced. Whether prospective monitoring and surveillance can prolong access survival currently is unproven. However, it fosters the ability to salvage vascular access sites through planning, coordination of effort, and elective corrective intervention, rather than urgent procedures or replacement.257 A number of monitoring and surveillance methods are available: sequential access flow, sequential dynamic or static pressures, recirculation measurements, and physical examination.
Failure to detect access dysfunction has consequences on morbidity and mortality.248,249 In a recent study of 721 randomly selected patients from all 22 long-term HD units in northeast Ohio, barriers found to significantly (P < 0.001) and independently relate to inadequate dialysis dose delivery were patient noncompliance, low dialysis prescription, catheter use, and access thrombosis.253 Every 0.1 decrease in Kt/V was independently and significantly (P < 0.05) associated with 11% more hospitalizations, 12% more hospital days, and a $940 increase in Medicare inpatient expenditures. Vascular access–related complications accounted for 24% of all hospital admissions.258 The reader is referred to the KDOQI HD Adequacy Guidelines for additional information on the importance of achieving the prescribed dialysis dose with regard to mortality.
Asymptomatic, but hemodynamically significant, stenoses usually are detected through a systematic monitoring and surveillance program. Detection of such stenoses is important to prevent progression to a functionally significant stenosis, currently defined as a decrease of greater than 50% of normal vessel diameter, accompanied by hemodynamic or clinical abnormality, such as abnormal recirculation values, elevated venous pressures, decreased blood flow, swollen extremity, unexplained reduction in Kt/V, or elevated negative arterial prepump pressures, that prevent increasing to acceptable blood flow.259 This definition evolves from an analysis of hemodynamics and clinical correlation.
Normal Hemodynamics
Access flow and pressure are related in a permanent AV access through the relationship:
![]()
The driving force for access flow, QA, is the pressure gradient, ∆P, between the artery and central veins. This driving force tends to be the same for both fistulae and grafts. Within the constraints imposed by the arterial anastomotic site, the ultimate access flow in mature accesses tends to be similar in fistulae and grafts.260,261 What differs is the rate of maturation. Grafts reach their maximum flow rate in a matter of days to weeks, as opposed to fistulae, which may require weeks to months to mature.71,138,262-264 This difference in achieving maximum flow may explain the difference in the incidence of immediate steal between the 2 access types, with the fistulae permitting more time for adaptation to occur.
The pressure profile differs in the 2 access types. As shown in Fig 3, the pressure decrease profile in a graft progressively decreases along the length of the graft. At both anastomoses, there are pressure gradients, even in the absence of stenosis (illustrated as the luminal incursions). Within the body of the graft, there is a 20- to 30-mm ∆P that is the effective driving force.265-267

Fig 3. Pressure profiles in grafts (top) and fistulae (bottom). Symbols: P, pressure;∆P, change in pressure; R, resistance; QAC, access flow; A, arterial; V, venous. Figure adapted from Sullivan K, Besarab A: Strategies for maintaining dialysis access patency. Chapter 11. In Cope C (ed): Current Techniques in Interventional Radiology (ed 2). Philadelphia, PA, Current Medicine, 1995, pp 125-131.
Conversely, in a fistula, the preponderance of the arterial pressure is dissipated within the first few centimeters of the access; pressures in the “arterial segment” are only approximately 20% of those in the feeding artery.265-267 Fig 4 shows the difference in profiles.
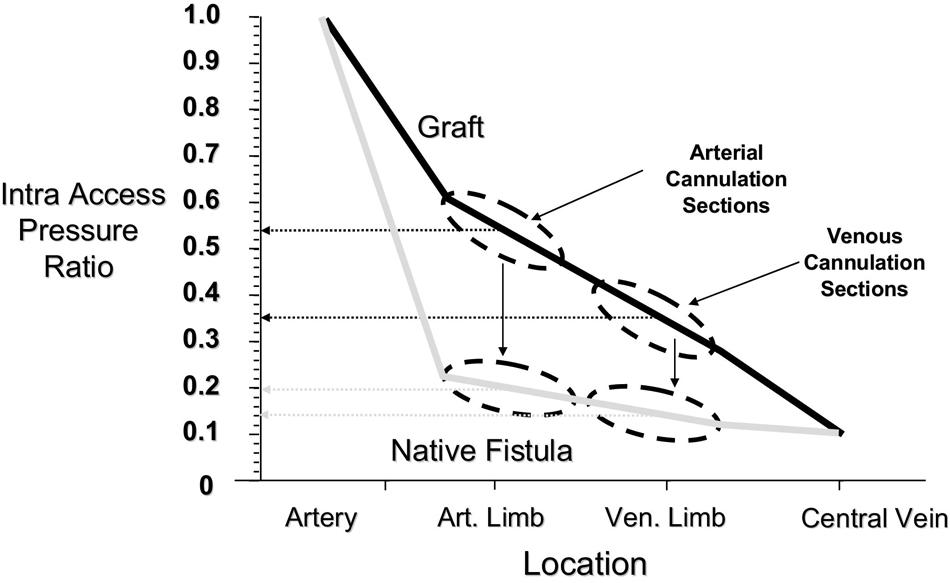
Fig 4. IAPs within normal grafts and fistulae. Reprinted with permission: Besarab A, Frinak S, Aslam M: Pressure measurements in the surveillance of vascular accesses. In Gray R (ed): A Multidisciplinary Approach for Hemodialysis Access. Philadelphia, PA, Lippincott Williams & Wilkins, 2002, Chapter 21, pp 137-150.
The IAP ratio refers to the actual pressure at the site of measurement divided by the mean arterial blood pressure (MAP). The effective ∆P in the fistula generally is only 8 to 10 mm Hg, frequently 25%, and seldom more than half those noted in grafts. Despite these differences in pressure profiles, access flow in grafts and fistulae are approximately equal at 6 months267 because the overall ∆P is the same. However, fistulae—unlike grafts—have an intact endothelial lining that allows them to actively dilate and remodel over extended periods. As a result, progressive flow increases are limited only by cardiac factors. Fistulae also differ from grafts in having side branches that reduce resistance to flow (parallel circuits). However, multiple accessory veins can limit the development of the major superficial vein needed for cannulation (see CPGs 1 and 2). Ligation of accessories or spontaneous occlusion of side branches within a fistula results in an access that hemodynamically mimics the profile of a graft.
It is immediately apparent that 2 anatomic factors determine access function: (1) quality and (2) physical dimensions of the artery and vein. The major determinant of QA in a given patient will be determined by the capacity of the artery to dilate and its general “health.” In general, arteries at more distal sites have less capacity to deliver flow than more proximal sites, ie, radial < brachial < axillary < femoral. Arteries that are calcified or affected by atherosclerosis will result in lower flow accesses whether supplying a fistula or a graft. If the artery is healthy, flow capacity will be determined by the characteristics of the vein used in access construction. Too small a vein will limit the flow in both a fistula and graft. Unfortunately, arterial disease is not uncommon; access inflow stenosis occurs in one third of the patients referred to interventional facilities with clinical evidence of venous stenosis or thrombosis.268 This is much greater than has been traditionally reported.10,24,105,108,269 Thus, it is very important to assess the access by using physical examination early after its construction. Because flow and pressure measurements are not performed routinely until the access is cannulated, initial assessment of the access depends on the physical examination, which can detect many problems in a fistula.
Effect of Stenosis on Hemodynamics: Access Flow, IAP, Access Recirculation, and Physical Examination
In grafts, the majority of stenoses develop in the venous outflow, frequently right at or within several centimeters of the venous anastomosis.10,24,105,108 Lesions within the graft also occur, and most accesses have more than 1 lesion at any 1 time.10,266,267,269 The pathophysiological state of graft failure arises from neointimal hyperplasia. In a fistula, there may be ischemic effects, as well as injury resulting from recurrent cannulation and subsequent fibrosis. Stenoses in a fistula tend to occur at the surgical swing sites (including the arterial anastomosis) or the puncture zone of the vein. The outcome is the same in both fistulae and grafts: a reduction in access flow rate. However, the effect on IAP differs according to access type and site of stenosis. As illustrated in Fig 5, an outlet stenosis in a graft will increase the pressure at all locations upstream from the stenosis. Conversely, an inflow lesion will decrease all pressures downstream of the stenosis. An intragraft stenosis between the needles will decrease flow while increasing pressure upstream and decreasing pressure downstream of the lesion.
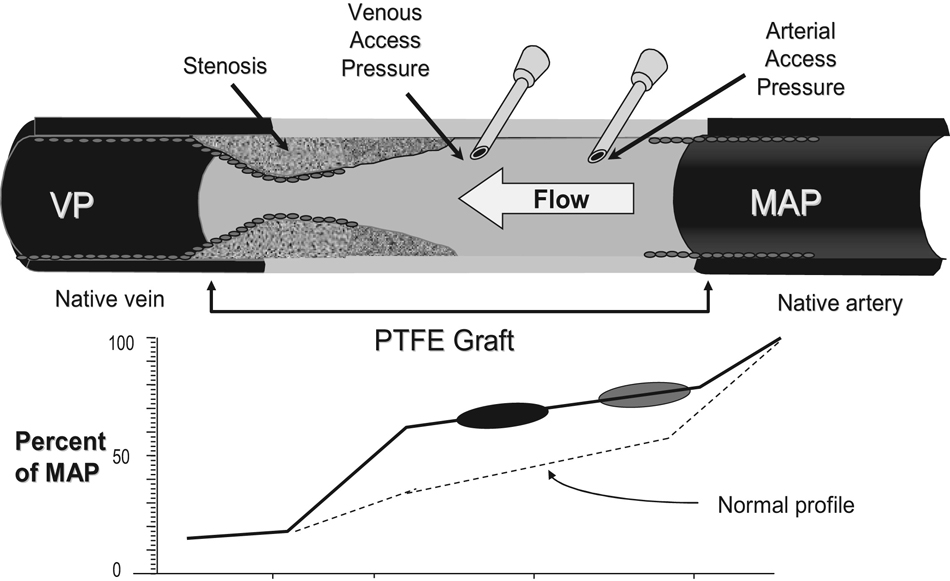
Fig 5. Effect of venous outlet stenosis on pressure profile. Reproduced with permission from Medisystems Inc.
In a fistula, pressure profiles depend on the location of the lesion and the presence or absence of collateral or accessory veins. Arterial inflow lesions that develop after acceptable maturation are detected more easily by using QA, the inability to deliver blood flow to the dialyzer, reductions in adequacy, and recirculation measurements270,271 than by IAP measurements. Intra-access pressure (PIA) with inflow lesions tends to remain unchanged or decrease as QA decreases over time.272 An outflow lesion will produce a pressure profile similar to that seen in grafts; the magnitude of the pressure elevation is dictated by the number of venous tributaries. Not uncommonly, in upper-arm fistulae, there is spontaneous or deliberate occlusion of side branches (as with transposition); an outflow lesion then produces a pressure profile very similar to that of grafts.
For a given graft access, the access flow pressure profile resulting from venous outflow stenosis is illustrated in Fig 6.
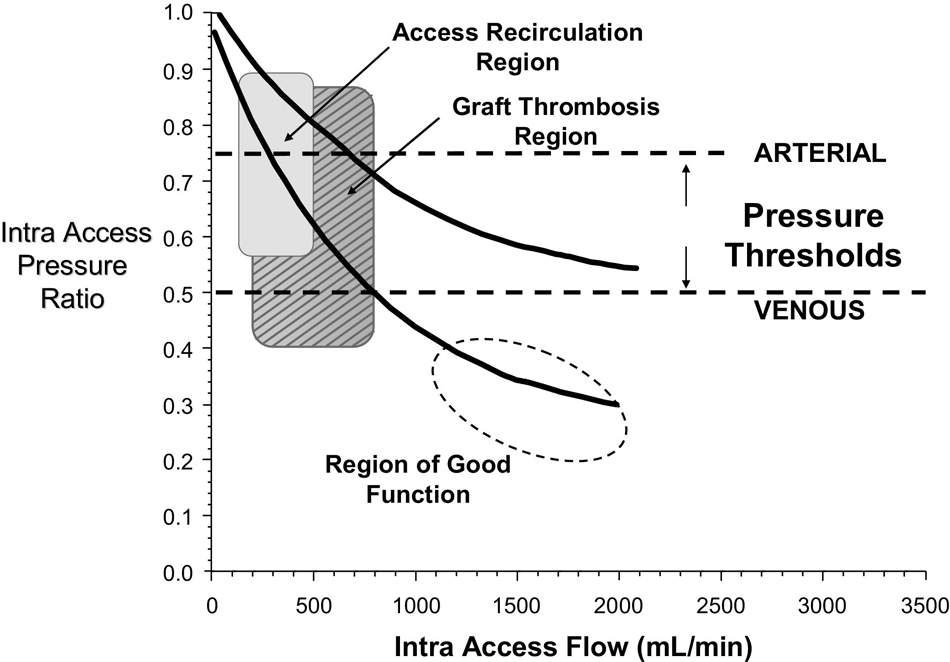
Fig 6. Effect of graft venous outlet stenosis. Reprinted with permission: Besarab A: Blood Purif 2006;24:77-89 (DOI: 10.1159/000089442). S. Karger AG, Basel.
An initially well-functioning graft with an access flow approaching 2 L/min (usually in the upper arm) will manifest decreasing flow as both the arterial and venous pressure slowly increase with the development of outflow tract stenosis. Hemodynamic simulations indicate that flow decreases by less than 20% until the stenosis process produces a 40% to 50% decrease in luminal diameter. Thereafter, flow decreases rapidly as the degree of stenosis increases to 80%.273 Because the intimal hyperplasia process progresses with time, its detection requires sequential measurements of flow or pressure or both to detect a threshold at which action should be taken. Note that the graft thrombosis region by flow shown in the hatched area is reached long before a graft would show recirculation and therefore affect the delivered dose of dialysis. Access recirculation in grafts is a late manifestation of stenosis and a poor predictor of imminent thrombosis; it occurs in less than 20% of cases.271 For this reason, the Work Group no longer recommends recirculation measurements in grafts. Conversely, because fistulae typically can maintain patency at much lower flows than grafts, recirculation occurs much more frequently; 1 study reported that about one third of fistulae had a significant recirculation fraction by using an ultrasound dilution technique.271 When recirculation was measured by using the Fresenius Body Thermal Monitor (BTM), the device was able to detect fistulae requiring revision with a sensitivity of 81.8% and specificity of 98.6%, although the BTM method does not differentiate between access and cardiopulmonary recirculation.274
The main issue for most HD clinics is which surveillance test best meets their needs. The following discussion summarizes the methods available and the reason for the ordering of the test by the Work Group in CPGs 4.2 and 4.3.
Physical Examination (Look, Touch, Listen)
Physical examination can be used as a monitoring tool to exclude low flows associated with impending graft failures.275,276 There are 3 components to the access examination: inspection (look), palpation (touch), and auscultation (listen).276 The Work Group is convinced that the basic skills have been largely abandoned in favor of technology and need to be taught to all individuals who perform HD procedures.277 Simple inspection can reveal the presence of aneurysms. A fistula that does not at least partially collapse with arm elevation is likely to have an outflow stenosis. This logic applies to the case in which a tourniquet does not appear necessary for optimal cannulation. Strictures can be palpated and the intensity and character of the bruits can suggest the location of stenosis. Downstream stenosis also produces an overall dilation of the vein, giving it “aneurysmal” proportions.
In grafts, one can determine the direction of flow in a loop configuration and avoid inadvertent recirculation by erroneous needle insertion. In a patent graft in which blood flow is less than the blood pump flow setting, the presence of recirculation can be detected easily by occluding the graft between the needles and looking at the arterial and venous pressures. A strong pulse too often is misinterpreted as being evidence of good flow, rather than the opposite. A pulse suggests lower flows.278 In a newly thrombosed graft, the arterial pulse often is transmitted into the proximal end of the graft, leading to erroneous cannulation, which could be avoided easily by simply using a stethoscope to confirm absence of flow. A bruit over an access system and its draining veins that is only systolic is always abnormal; it should be continuous. An intensification of bruit suggests a stricture or stenosis.278 Palpable thrill at the arterial, middle, and venous segments of the graft predicts flows greater than 450 mL/min.278 A palpable thrill in the axilla correlates with a flow of at least 500 mL/min.279 The character of pulse and thrill correlates with postintervention outcome for stenosis.280 The interested reader is referred to additional literature for further enjoyment and enlightenment.271
Of note, a preliminary study has shown that sounds acquired by using electronic stethoscopes that were then digitized and analyzed on a personal computer could be used to characterize stenoses.281 Stenotic vessel changes were found to be associated with changes in acoustic amplitude and/or spectral energy distribution. Acoustic parameters correlated well (r = 0.98; P < 0.0001) with change in degree of stenosis, suggesting that stenosis severity may be predicted from these parameters. Furthermore, acoustic parameters appeared to be sensitive to modest diameter changes of 20%. These results suggest that, in the future, readily available computerized analysis of vascular sounds may be useful in vessel patency surveillance.
Access Flow
Access flow can be measured by using a number of techniques, as summarized in Table 7. Doppler ultrasound (DU)282-287 and MRA46,54,288-290 are direct techniques for assessing flow in vascular accesses. Duplex Doppler ultrasound (DDU) requires an accurate measurement of the cross-sectional diameter of the access. The method is operator dependent and subject to error caused by variation in cross-sectional area and the angle of insonation.291,292 Because turbulence in the access can limit the accuracy of the measurements, flow measurements can be made in the feeding artery (usually the brachial) or distal part of the access.272 The difference between the flow in the artery and the access usually is less than 10%. Despite these operator-related and equipment-related limitations, sequential measurements have been used extensively to detect and refer patients for interventions or predict the risk for thrombosis. In addition to flow measurements, both DDU and MRA provide anatomic assessment and direct evidence for the presence, location, and severity of access stenosis. However, the current cost of these methods, as well as the inability to make measurements during HD, limits their use. Research and development are needed to simplify procedures and reduce costs.
Indirect methods use an indicator dilution technique; the major techniques include ultrasound dilution (UDT),272,293 a timed ultrafiltration method294; transcutaneous access flow rate (TQA), a method that can be performed during or independently of HD295,296; glucose infusion297,298; differential conductivity299,300; and, finally, ionic dialysance.301,302 All the methods described, except for TQA, variable flow DU, and glucose infusion, require measurements with the blood tubing initially in the normal position and then reversed to induce access recirculation.
With UDT, access flow is measured from the induced recirculation when the needles are reversed. The software calculates the area under the curves (AUC) as a measure of recirculation.
![]()
where QBP is blood pump flow and R is degree of recirculation induced. The UDT method is the only one that independently measures actual flow in the tubings, rather than accepting the readings on the HD system for the roller pump.
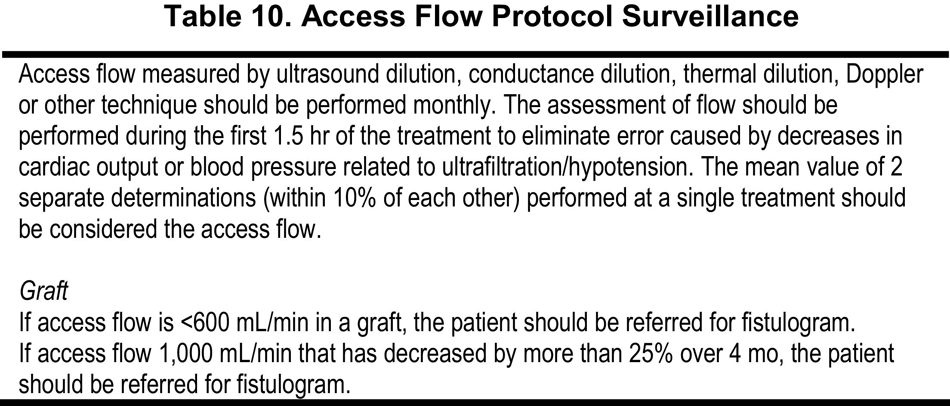
Pitfalls in measurement have been identified and recently reviewed.303 Accurate calibration of the blood pump is essential with most methods, but frequently is not performed regularly. The indicator injection also must not affect flow in the access itself. The technique must separate access recirculation from cardiopulmonary recirculation that is unavailable with high-efficiency dialysis. Finally, access flow is a function of the ratio of systemic to access resistance, and measurements should be conducted within the first 90 minutes of dialysis to minimize effects of hypotension. Table 10 summarizes the recommendations for access flow surveillance. All methods require some modification/interruption of the dialysis treatment, except perhaps ionic dialysance.
With ionic dialysance, alteration of the proportioning ratio of dialysate to water alters the dialysis sodium concentration, as well as blood sodium level. The resulting change in blood sodium level, as well as the change in dialysate conductivity, serves as the indicator for calculating QA.
![]()
where D is the dialysance in the normal blood tubing position and Dr is the value with the tubing reversed. As with UDT, ultrafiltration should be minimized and recirculation must be absent in the normal blood tubing configuration. At flow rates less than 1,000 mL/min, the method consistently underestimates access flow compared with UDT.301,302
With the timed ultrafiltration method, a difference in hematocrit (Hct) is the indicator

where Qf is ultrafiltration rate, H0 is initial Hct, and ∆H is change in Hct induced by ultrafiltration with the tubing in reversed (r) and normal (n) positions. The method correlates well with UDT.
The TQA method has not been extensively used.
The variable-flow DU method304-306 measures velocity between the 2 dialysis needles at varying dialyzer blood flows. Using a conservation of volume approach, a computer algorithm solves for access flow without the need to measure the cross-sectional diameter of the access.306 The method's accuracy is best at flows less than 1,000 mL/min.
The easy availability of urea as a marker has led some to use it as an indicator substance to calculate recirculation and therefore derive flow. Such measurements underestimate flow compared with conductivity.307 Although QA can be estimated by using the urea method, the sensitivity and specificity of a low value is a poor predictor of access outcome and may lead to cost-ineffective investigations.307
Variation in access flow during dialysis308 can result from changes with cardiac output,309-311 MAP,309,310 and changes in blood volume.311 Access flow can increase by up to 11% or decrease by up to 30% from initial values by the end of dialysis, potentially impairing the ability of QA to predict impending vascular access failure.312 Access resistance remains stable during treatments and could be a more useful measure of vascular access performance as part of an access surveillance program. For all these reasons, it is recommended that measurements be made early in the HD treatment.
Access Pressure
Measurements of pressure from the HD circuit were not originally designed to assess access (dys)function, either directly or indirectly. Rather, they were used to calculate the mean transmembrane pressure so that the appropriate ultrafiltration rate could be achieved. Volumetric control systems made these measurements unnecessary. Pressure measurements were retained to provide safety. During HD, blood is drawn out of the vascular access through the arterial needle by the blood pump on the HD machine.
Prepump pressures are now used to determine whether the prescribed dialyzer blood flow can be delivered without generating excessive negative pressures. At high negative pressures, the collapse of the pump segment reduces the true flow and true flow may differ from “displayed” flow by up to 15%.313,314 The degree of collapse is affected, in turn, by differences among manufacturer tubing sets.315 These considerations are important in evaluating the relationship of flow to access pressure. Excessively negative pressures can result in hemolysis.316 Differences in blood tubing performance are of obvious importance to manufacturers, leading to improvements. The newer generations available may show little differences with the improved blood flow delivered during dialysis, benefiting all patients.
When blood passes through the dialyzer, the blood traverses the venous drip chamber and returns to the patient's vascular access though the venous needle. The pressure required to infuse blood back into the access is recorded as the venous drip chamber pressure (VDP) or DVP. The original purpose of VDP was to detect infiltration or malpositioning of the needle because partial occlusion of the needle orifice or infiltration would quickly increase and sound an alarm. There still is no “alarm” for detecting accidental withdrawal of the needle outside the body; exsanguinations have occurred.
One of the components of the VDP is the actual IAP (PIA). As shown in Fig 4, the IAP (PIA) in a graft is usually less than 50% of MAP. Most of this pressure decrease occurs at the arterial anastomosis, unless there is intragraft stenosis. When outflow stenosis develops (eg, because of neointimal hyperplasia at or downstream from the graft-vein anastomosis), PIA increases and flow decreases. When PIA increases to greater than 50% of MAP (PIA/MAP greater than 0.50), graft flow commonly has decreased into the thrombosis-prone range of 600 to 800 mL/min (Fig 6), and the presence of stenosis is likely. If a stenosis develops in the body of a graft between the areas used for arterial and venous limb cannulation, PIA at the venous needle remains normal or can even decrease despite increasing stenosis.270,271 Stenosis at the arterial anastomosis of both grafts and fistulae causes PIA to decrease. Conversely, a high basal PIA can be observed with a healthy artery in the absence of stenosis when the flow delivered is in excess of the venous system's initial capacity. Because of these pressure confounders, there is little correlation between a single measurement of flow and PIA/MAP.317 Serial measurements of pressure in each patient are more valuable than isolated measurements of either PIA or PIA/MAP ratio. This is illustrated in Fig 7. Note that the arterial pressure ratio is approximately 0.2 units higher than the venous ratio and the baseline initial value for both ratios is lower than usual because of the use of a 4- to 6-cm taper at the arterial anastomosis that limits inflow to prevent steal.
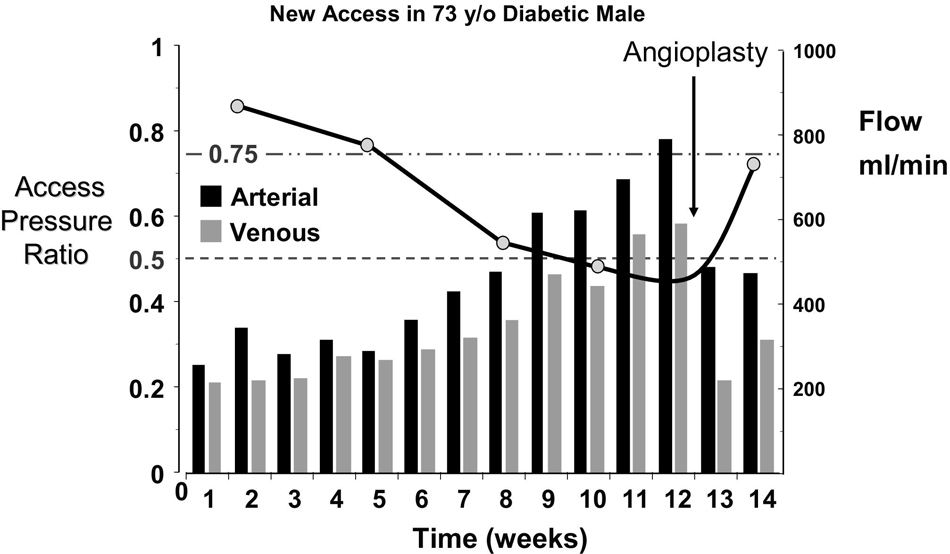
Fig 7. Relationship of IAP ratio to access flow. Reprinted with permission: Besarab A: Blood Purif 2006;24:77-89 (DOI: 10.1159/000089442). S. Karger AG, Basel.
In fistulae, blood entering the venous system returns through multiple collateral veins. As a consequence, PIA/MAP in a fistula is, on average, less than in a graft and may not increase with outlet stenosis. The test, therefore, theoretically is less valuable as a surveillance tool for stenosis in fistulae. However, most elbow-level fistulae do not have or lose collaterals and often behave hemodynamically like grafts. In both fistula types, elevation of PIA/MAP indicates the development of a stenosis in the venous outflow from the access and is associated with an increased probability of access failure or need for revision to provide adequate blood flow for HD.10,265,266,317
Like access flow, measurement of PIA has evolved.
Direct measurement of static pressure.
Pressures in the access can be measured directly at the site of cannulation in the “arterial” and “venous” segments of the graft or fistula by using a pressure-measuring device. Although one can use a sophisticated electronic method (separate transducers placed in line with the dialysis tubing)265-267 as originally reported, a much simpler technique uses a device consisting of a hydrophobic Luer-Lok connector that connects a standard dialysis needle to an aneroid manometer.318
IAPs also can be measured by using the pressure transducers of the dialysis machine. Under conditions of no blood flow and no ultrafiltration, the only difference between the pressure measured by an independent transducer and the machine transducer is that resulting from the height differential between the location of the machine transducers and the access. The two pressures can be equated by either moving the access to the level of the venous drip chamber or moving the drip chamber to the level of the access. Alternatively, the height difference, ∆h, can be measured and the additional pressure (0.76 •∆h) can be added to the machine transducer reading.319
Table 8 provides the sequence of steps for measuring static pressure. It is important that the pressure transducers be calibrated accurately.
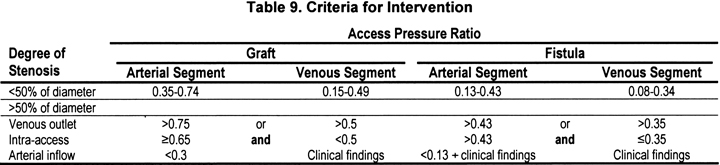
Interpretation. Venous outlet stenosis can be detected with venous PIA alone. Trend analysis is more useful than any single measurement. The greater the degree of stenosis at the outlet, the greater the venous pressure ratio. Strictures between the area of arterial and needle cannulation cannot be detected by measuring venous (PIA) pressure alone.271 Detection of these lesions requires simultaneous measurement of pressures from both the arterial and venous needles. Central stenoses that have collateral circulation may have “normal” pressures, but these usually present with significant ipsilateral edema. Accesses can be classified into the categories listed in Table 9. Using the equivalent PIA ratios from the arterial or venous needles, the criteria must be met on each of 2 consecutive weeks to have a high likelihood of a 50% diameter lesion.
Patients who develop a progressive and reproducible increase in venous or arterial segment greater than 0.25 units more than their previous baseline, irrespective of access type, also are likely to have a hemodynamically significant lesion. Intra-access strictures usually are characterized by the development of a difference between the arterial and venous pressure ratios greater than 0.5 in grafts or greater than 0.3 in native fistulae. Because fistulae can remain patent at much lower flows than grafts, sequential measurement of conductance (ie, a blood pump/absolute value of prepump pressure), particularly at maximum prepump pressure permitted by the system, can detect fistula dysfunction and stenosis.320,321
Although measuring static pressure as described in Table 8 is straightforward, it is tedious, time consuming, and not “user friendly.” Staff frequently bypass crucial steps, leading to poor-quality data being collected and recorded. This has led to a reevaluation of statistical methods to use the information within the dynamic pressure.
VDP or DVP and extraction of equivalent PIA. DVP (also referred to as VDP under conditions of blood flow) is measured routinely during HD in the presence of extracorporeal blood flow. These pressures can be read off the dialysis machine or stored electronically with the blood pump running. One of the components of DVP is the actual IAP (PIA) because the pressure needed to return blood into the access is the sum of that needed to overcome the needle resistance and IAP. DVP/VDP has been used to detect venous outlet problems,322 but measurements are meaningful only if obtained at the beginning of dialysis and usually with low BFRs (50 to 225 mL/min) because at high BFRs, much of the resistance to flow is from the needle, and not the vascular access.
Measurement of DVP is less sensitive and specific than direct measurements of access flow rates or static pressure measurements. The reason for “poorer” performance results from many factors, including the lack of consistency about which flow should be the standard, varying in studies from 50 to 425 mL/min322-325; differences in needle design (wall thickness, actual length); and effects of viscosity affected chiefly by Hct. In addition, use of DVP as a method also requires that studies be performed to standardize the critical value as a function of needle gauge, length, and inner diameter (wall thickness). Consistency requires that a uniform flow value to test at be determined.
Indirect methods for determining PIA. Most HD systems can store the blood pump values associated with DVP. A computerized algorithm has been developed that uses an empirical formula to calculate an equivalent PIA from the DVP made during treatment. During a given treatment, many measurements at different flows can be made along with the simultaneous MAP, and an average equivalent PIA/MAP can be calculated. The average values can be trended with each treatment and examined for an upward trend. When the ratio exceeds 0.55, the access has a greater risk for clotting.326 This technique has been commercialized, providing monthly reports and trend analysis. Its ability to predict thrombosis is equal to that of direct measurement of PIA. In the evolution of the IAP ratio to detect stenosis, the discriminator value has progressively increased from 0.4 using the ratio of systolic pressures, 0.45 using the ratio of mean pressures measured directly, 0.5 using transducers on the machine, and finally 0.55 when deriving PIA from the dynamic pressure.
Recirculation: Method, Limits, Evaluation, and Follow-Up
Recirculation is the return of dialyzed blood to the dialyzer without equilibration with the systemic arterial circulation. The technique is not recommended as a surveillance tests in grafts. However, up to one third of dysfunctional fistulae will show an increase in recirculation that may be manifested as a decrease in urea reduction ratio (URR) or Kt/V, but this occurs late.
Access recirculation in a properly cannulated access is a sign of low access blood flow192 and a marker for the presence of vascular access stenosis, particularly in fistulae. Such stenoses can be corrected, preventing underdialysis and decreasing the risk for access thrombosis.327 Access recirculation can be measured accurately by using UDT328 or conductivity.299 A K+-dilution method is more reliable than the 2-needle urea-based method and compared with UDT, has 100% sensitivity, 95% specificity, 91% positive predictive value, and 100% negative predictive value.329 In analogy to access flow measurement, glucose infusion also has been used to measure recirculation.330
The amount of recirculation occurring with reversed needles usually is substantial (>20%), as confirmed when the tubings are deliberately reversed for access flow measurements. However, even with ideal sample timing and proper cannulation, laboratory variability in urea-based measurement methods will produce variability in calculated recirculation.331 Therefore, individual recirculation values less than 10% by using urea-based methods may be clinically unimportant. The Work Group believes that they do not prompt further evaluation. Values greater than 10% by using urea-based recirculation measurement methods require investigation.
New loop grafts are at particular risk for reversed needle placement because of a lack of familiarity with the access anatomy. When possible, an access diagram that depicts the arterial and venous limbs should be obtained from the surgeon who constructed the access to aid in proper cannulation. If not available, the anatomy can be deduced by temporarily occluding the graft at its midportion. The portion retaining a pulse is the arterial limb.
Comparison of Surveillance Methods
Accuracy and Reproducibility
Only 1 study has directly compared many of the available flow techniques with regard to reproducibility.332 Reproducibility is assessed by using duplicate measurement at unchanged conditions, whereas accuracy is determined under controlled change in a relevant measurement condition (2 different blood flows for ultrasound, changed sensor position in TQA). An accurate method produces the same result. In most studies using some form of dilution or concentration of an indicator, UDT is taken as the reference method for comparison because it most accurately separates cardiopulmonary from access recirculation and independently measures blood flow to the dialyzer. Ultrasonic flow is approximately 10% to 15% less than indicated by the blood roller pump, the magnitude correlating inversely with negative arterial blood tubing pressure.333 It shows very high reproducibility, for measurement at the same extra corporeal blood flow, QB (correlation coefficient of duplicate measurement, r = 0.97; n = 58) and measurement at 2 different QB (r = 0.97; n = 24), justifying its current status of a reference method in QA evaluation.334 The coefficient of variation usually is less than 8%.327 Slightly lower reproducibility is found with thermal dilution (TD) or Fresenius BTM at the same QB (r = 0.92; n = 40) and 2 different QB (r = 0.851; n =168); this inaccuracy can be overcome by increasing the number of measurements with averaging. Use of the simple Krivitski formula, QA = QBP (1/R − 1) in TD (which measures total recirculation, ie, sum of access recirculation and cardiopulmonary recirculation) brings about underestimation of QA, which progressively increases from QA of about 600 mL/min upward. High correlation of TD versus UDT (r = 0.95; n = 54) makes TD a viable clinical alternative in QA evaluation. Consistently different QA values obtained at 2 different QBs should prompt closer investigation of anatomic conditions of the access. Good correlation (r = 0.87; n = 27) also is found between QA measured by using DDU and UDT.332,335
The direct TQA method showed very high reproducibility (r = 0.97; n = 85); however, only for unchanged sensor position. Correlation of QA measured at 2 different sensor positions was much worse (r = 0.73; n = 22). Correspondence of TQA with UDT was satisfactory (r = 0.81; n = 36). Skilled and experienced operators are a must with this method. Similar results were found by others who reported, for triplicate measurements, coefficients of variation of 7.5% for differential conductivity by hemodynamic monitoring (HDM), 9.1% for UDT, and 17.4% for optodilution by ultrafiltration (OABF).336 Repeatability data (variation among temporally separated measurements) showed values of 10.6% for HDM, 13.0% for UDT, and 25.2% for OABF. Fewer comparisons have been made with the other methods. Glucose pump test (GPT) flow measurements correlate well with UDT measurements and have acceptable replicability.298
Ionic dialysance or conductivity dialysance, as it frequently is referred to, is being used increasingly by clinicians to measure access flow in both the United States and Europe, particularly with Fresenius dialysis delivery systems, in which the methodology is built into the machines as on-line clearance. Major refinements have been made to increase the replicability and accuracy of this method at lower BFRs, but preliminary reports comparing the measurements with UDT have not yet been formally published.
Detection of Stenosis or Predicting Thrombosis
As important as accuracy of a method is, the goal of any surveillance method is to detect access stenosis in a timely way so that appropriate correction can be undertaken before thrombosis. A hemodynamically significant stenosis is the substrate for thrombosis by reducing flow, increasing turbulence, and increasing platelet activation and residence time against the vessel wall.
Table 11 summarizes the available studies in which the presence and degree of stenosis was confirmed by using angiography. As reflected by data in the table, DDU is most accurate because it can directly visualize the degree of stenosis. When DDU is used to measure flow, rather than identify anatomic stenosis, sensitivity and specificity decrease. A quick survey of the table clearly shows that none of the tests consistently achieves a sensitivity of 90% and specificity greater than 80%.
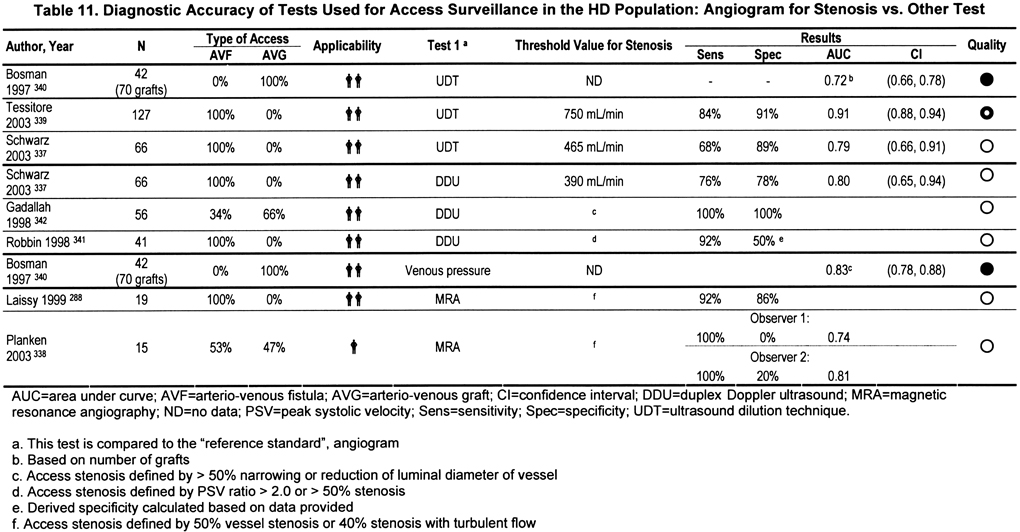
Because of the accuracy of DDU in detecting the presence of a 50% (by diameter) stenosis,337 it has been used in some studies as the reference method, rather than angiography, to avoid invasive procedures. As shown in Table 12, Table 12 UDT has good accuracy, whereas physical examination has high specificity, but poor sensitivity.
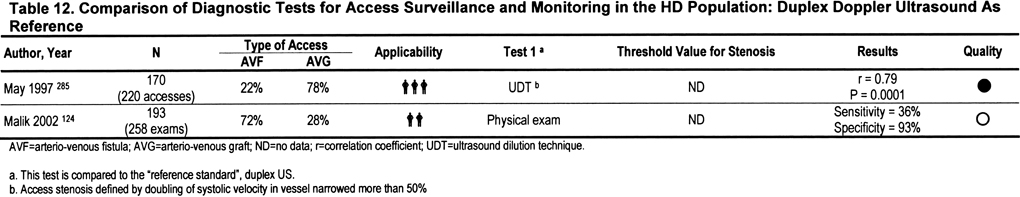
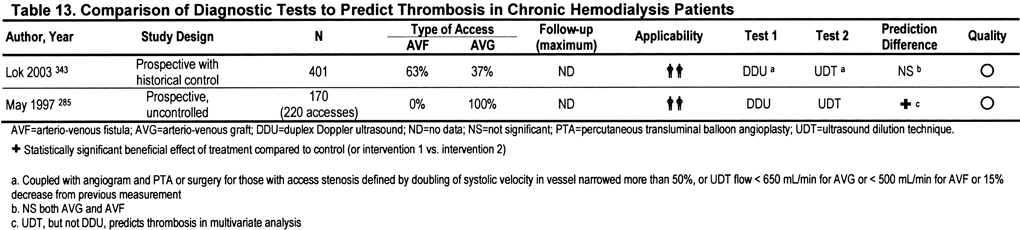
Table 13 shows that DDU and UDT are equivalent in predicting thrombosis.
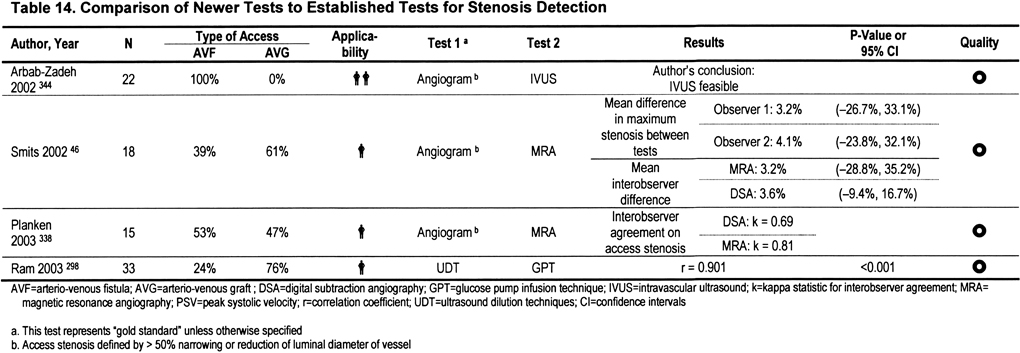
Data are still limited for some of the newer surveillance tests. Table 14 summarizes the observations. There is excellent correlation between flow measurements by means of GPT and UDT (r > 0.9).298 GPT also has been validated recently as a surveillance technique in grafts. Using DDU to assess for the presence of stenosis, GPT picked up severe stenosis in 14 of 112 grafts (100% sensitivity) and performed better than UDT (86% sensitivity).297 Specificity was less than 60% for both tests. Diagnostic efficiency (percentage of grafts with agreement between test result and factual situation) was 90% and 80% (P = 0.056) for GPT and UDT, respectively. MRA also can provide anatomic338 and QA measurements, but it is prohibitively expensive. Intravascular ultrasounds (IVUSs) can be used to evaluate abnormalities in fistulae297 and may find abnormalities not seen with angiography. However, it is too expensive for routine use, but may be a valuable adjunct in evaluating the efficacy or completeness of the intervention on the access.
An important issue in fistulae is the assessment of such abnormalities as aneurysms and extreme tortuosity in “well-functioning” fistulae. DU is a very valuable technique, particularly in fistulae; in addition to measuring flow and identifying stenosis directly, it can detect other abnormalities in presumably well-functioning accesses.345 Pseudoaneurysms do not decrease access flow; QA is significantly greater than the mean (1,204 mL/min) in fistulae with aneurysms, calcifications, and tortuous vessels and, of course, less in those with stenosis. No correlation is noted between QA or the presence of stenosis with fistula age. Some degree of stenosis was detected in 64% of fistulae, with 57% of stenoses located in the anastomotic region; 22%, in the vein junction; 19%, at 1 or both ends of the aneurysm; and 2%, in the remaining region of the efferent vein.345 Chronic venous occlusion with collateral veins was detected in 6% of fistulae.345 Aneurysms were observed in 54% of fistulae with a mean diameter of 12.4 mm, with 96% of them located at puncture sites. Ten patients had a small thrombus in an aneurysm and at puncture sites. Thus, although a high level of abnormalities is present in well-functioning mature fistulae, the abnormalities are not sufficient to affect the functioning of the HD fistula and, in most cases, need only observation. More advanced lesions require therapy (see CPG 5).
DDU is a particularly useful modality to determine reasons for maturation failure of fistulae 4 to 12 weeks after construction,346 even if preoperative vein mapping had shown adequate vein size (≥3 mm) and outflow. Using the criteria of peak systolic velocity ratio (SVR) of 2:1 or greater to detect a 50% or greater stenosis involving arterial inflow, and venous outflow and an SVR of 3:1 or greater to detect a 50% or greater anastomotic stenosis, DDU of 54 native fistulae (23 brachiocephalic, 14 radiocephalic, and 17 basilic vein transpositions) found that 20% were occluded and 26% were normal. The remainder showed a variety of lesions: 16 fistulae (42%), venous outflow; 13 fistulae (34%), anastomotic; and 2 fistulae (5%), inflow stenoses. In 7 fistulae (18%), branch steal with reduced flow was found. Sensitivity, specificity, and accuracy of DDU in detecting stenoses of 50% or greater were 93%, 94%, and 97% compared with fistulography, respectively. Because many of these fistulae cannot be studied by using other surveillance techniques, routine DDU surveillance of primary fistulae should be considered to identify and refer for correction of flow-limiting stenoses that may compromise the long-term patency and use of the fistula.
Inflow stenosis is more common than previously believed (ie, <5% of cases). An inflow stenosis is defined as stenosis within the arterial system, artery-graft anastomosis (graft cases), artery-vein anastomosis (fistula cases), or juxta-anastomotic region (the first 2 cm downstream from the arterial anastomosis) with a 50% or greater reduction in luminal diameter judged by comparison with either the adjacent vessel or graft. Such stenosis was found in nearly a third of 223 cases referred to an interventional facility serving several centers.268 All referred accesses had a coexisting stenosis on the venous side. The frequency of inflow stenosis was less in grafts (29% of cases) than fistulae (40 of 101; 40%). Of these, 22 (54%) had a coexisting lesion on the venous side. Access inflow stenosis thus is much greater than traditionally reported in cases referred to interventional facilities with clinical evidence of venous stenosis or thrombosis.
Attempts to combine the various surveillance techniques have been performed. One study found no difference in the ability to detect stenoses in grafts from using QA by UDT compared with static venous pressure ratios.340 However, DVPs were of little use. Use of a PIA compared with QA also was examined in 125 grafts followed up for 80.5 patient-years.347 Standardized monitoring of either PIA, QA, or the combination of both, followed by subsequent corrective intervention, decreased the thrombosis rate in grafts compared with a historical control rate.348 Rates in 2 separate parts of the study for thrombosis not preceded by a positive test result were 0.24 and 0.32 episodes/patient-year at risk compared wth a historical rate greater than 0.7, respectively. The surveillance strategies were equally effective in decreasing thrombosis rates, and access survival curves were not significantly different between subgroups.347 Again, DVP alone was not useful because either QA or PIA turned positive before the dynamic pressure limit (>150 mm Hg at 200 mL/min) was reached. Unlike these 2 studies showing limited to no utility of DVP alone, another study was able to find some utility for DVP measurements for grafts.349 Stenosis greater than 50% by diameter on fistulography or a thrombotic event was defined as a “vascular access impairment episode,” whereas stenosis less than 50% or the absence of a thrombotic event was defined as “no vascular access impairment episode.” By combined dynamic pressure readings and flow surveillance (DVP > 120 mm Hg; QA< 500 mL/min in fistulae and < 650 mL/min in grafts or a decrease in QA> 25% compared with the highest previously measured value were considered positive), improved sensitivity over flow alone for fistulae, but not grafts, was observed.268 Sensitivity and specificity of the combined surveillance protocol for fistulae were 73.3% and 91%; in grafts, they were 68.8% and 87.5%, respectively. The rate of thrombotic events was less in patients with fistulae who underwent early repair, but in grafts, the addition of DVP did not decrease the thrombosis rate any further than surveillance based on QA alone. Finally, when UDT, DDU flow, DVP, and prepump pressure were examined as predictors of thrombosis in 172 grafts, DVP used alone was not predictive.285
In summary, available data suggest that the utility of DVP at flows of 150 to 225 mL/min to predict stenosis or thrombosis is limited or absent in grafts. Studies are needed to determine whether the method retains any utility in fistulae. Conversely, flow measurements, DDU assessment for stenosis, and static pressure measurements (direct or indirect by using computers) can detect hemodynamically significant stenosis in grafts and fistulae. Although the location of stenosis in fistulae (inflow) favors QA over PIA, no direct comparisons have been made by using DDU anatomic imaging or contrast angiography to determine the accuracy of the techniques in this access type. If the prescribed Kt/V is not delivered in a patient who is using a fistula, measurement of access flow should be performed by using a recommended method (Table 7).
The Work Group believes there is insufficient evidence to suggest 1 surveillance technique from those listed in the guidelines as “preferred or acceptable” because the choice at a particular site is affected by many variables; chief among these are access type, technology, effect of operator, and cost (usually labor). Although DDU studies are predictive of access stenosis and the likelihood for failure,350 frequency of measurement is limited by expense. In addition, interobserver variability in measurement of DDU flow in some instances can reduce the reliability of DDU flow measurement.351 Variation in the internal software used for calculating DDU flow measurements by different manufacturers also is a factor preventing standardization. Magnetic resonance flow is accurate, but expensive. Both DDU flow and magnetic resonance are difficult to perform during HD sessions.
Conversely, flow measurements performed by using UDT and other techniques can be done on-line during HD, thereby providing rapid feedback. The same applies for PIA. Both access flow and IAP techniques have been validated in prospective observational studies.10,322,347,349,352,353 Measuring static venous pressures is the least expensive method of surveillance for stenosis.322,354 Because of efficiency or cost, these methods are listed as preferred. In-line access flow measurements (DDU) are available and have been improved in terms of accuracy and replicability. However, there are no data yet on efficacy in detecting stenosis or effect on thrombosis rate.
The Work Group believes that recirculation is a relatively late predictor of access dysfunction and, if used, has a minor role in fistulae only. Non–urea-based recirculation measurements are very accurate, but require specialized devices.
Unexplained decreases in delivered dialysis dose, measured by using Kt/V or URR, frequently are associated with venous outflow stenoses.355 However, many other factors influence Kt/V and URR, making them less sensitive and less specific for detecting access dysfunction. Inadequate delivery of dialysis dose is more likely to occur with a fistula than a graft.
In primary fistulae, inadequate flow through the access is the main functional defect predictive of thrombosis and access failure (defined as thrombosis or failure to provide adequate dialysis dose). Indirect measures of flow, such as dynamic and static venous dialysis pressure, may be less predictive of thrombosis and access failure in fistulae compared with grafts. However, measurement of recirculation becomes a more useful screening tool in fistulae compared with grafts because flow in fistulae, unlike grafts, can decrease to a level less than the prescribed blood pump flow (ie, <300 to 500 mL/min) while still maintaining access patency.192,270,271 DDU may be useful in fistulae.346 Comparative studies using HDM (QA, PIA) and DDU need to be performed before firm recommendations can be made by the Work Group.
Regular assessment of physical findings (monitoring) may supplement and enhance an organized surveillance program to detect access dysfunction. Specific findings predictive of venous stenoses include edema of the access extremity, prolonged postvenipuncture bleeding (in the absence of excessive anticoagulation), failure of the vein to collapse with arm elevation, and changes in physical characteristics of the pulse or thrill in the graft.108,354 Physical examination is a useful screening tool to exclude low flow (<450 mL/min) in grafts with impending failure.275,277,278 In the context of proper needle position, an elevated negative arterial prepump pressure that prevents increasing the BFR to the prescribed level also is predictive of arterial inflow stenoses.
When a test indicates the likely presence of a stenosis, angiography should be used to definitively establish the presence and degree of stenosis. Currently, the Work Group is in agreement with the Society for Interventional Radiology, which recommends angioplasty if the stenosis is greater than 50% by diameter. Angioplasty by its very nature is a “disruptive” force on the vessel and can injure endothelium and underlying smooth muscle; each angioplasty can produce benefit or harm. However, there have been no large-scale trials to determine whether correction of only “hemodynamically” significant lesions (those associated with “low” access flows or “high” pressures or a change in access flow or pressure) is superior to correction of all stenosis greater than 50%. At the time of intervention, hemodynamic evaluation of each stenosis generally is not carried out.
Until such studies are conducted, the Work Group believes that the value of routine use of any technique for detecting anatomic stenosis alone—without concomitant measurement of access flow, venous pressure, recirculation, or other physiological parameters—has not been established. Stenotic lesions should not be repaired merely because they are present. If such correction is performed, then intraprocedural studies of QA or PIA before and after PTA should be conducted to show a functional improvement with a “successful” PTA.
The Patient as His or Her Own Surveyor and Protector
The Work Group strongly advocates that all patients should be taught the “basics” of how to take care of their vascular access, including steps in personal hygiene, cleanliness, avoidance of scab picking, and so on, as discussed in Table 15. In addition, patients should be taught where and how to detect a “pulse,” where and how to feel for a thrill, how to recognize infection, and—most importantly—when to notify a member of the dialysis staff of physician when the pulse or thrill is absent. Delay in recognizing loss of patency may influence the likelihood of restoring patency.
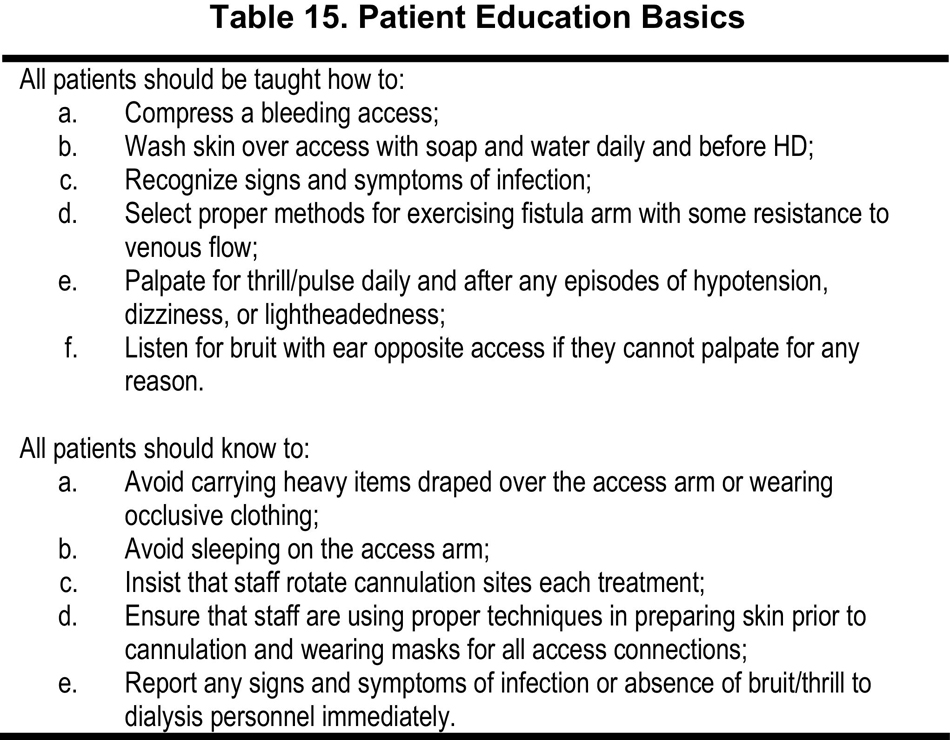
The patient must be taught the reason for avoiding “1-site-itis.” Topical anesthetics should be used judiciously if they help the patient comply with the policy of rotation of needle sites. To avoid aneurysm formation, the patient should insist on site rotation unless a buttonhole method is being used in a native fistula. With the large staff turnover ratios prevalent in HD units in the United States, the patient must be diligent that staff uses the proper aseptic techniques whenever the access is palpated, inspected, or cannulated.
Surveillance and Thrombosis
Nonrandomized Trials
In dialysis AVGs, thrombotic events result primarily, but not solely, from progressive venous outflow stenosis.10,24,105,300,354,356-358 Thrombotic events that cannot be resolved (ie, patency restored) are the leading cause of access loss. These stenoses are caused by intimal and fibromuscular hyperplasia in the venous outflow tract, typically at the graft venous anastomosis,359-362 but can occur in the body of the graft, as well. The details of pathophysiology are beyond the limits of this discourse except to state that, to date, promising therapies in animal models have not yielded success in humans. Possible future therapeutic approaches have been summarized.363
As stenoses increase in severity, they produce a resistance to flow, increasing PIA with an accompanying decrease in blood flow.266,318 Cross-sectional studies using DDU or UDT showed a progressive increase in risk for access thrombosis during a follow-up interval of 1 to 6 months. The absolute value of the “critical or threshold” QA depends on the method used. Average access flow rates obtained by DDU are less (600 to 900 mL/min)252,335,364 than those measured by using magnetic inductance (mean, 1,100 mL/min) or UDT (mean range, 900 to 1,200 mL/min).336 Studies also showed that when access flow is measured repeatedly, trends of decreasing flow add predictive power for the detection of access stenosis or thrombosis.284-286,300,311,318,349,364-371 Grafts with access blood flows less than 600 to 800 mL/min have a greater rate of access thrombosis than grafts with flow rates greater than 800 mL/min.268,284,286,300,311,318,372 In addition to this absolute value, a decrease of 25% in access flow from a previous “stable” baseline greater than 1,000 mL/min has been suggested as a criterion for further diagnostic evaluation of grafts to detect the presence of at least one 50% (by diameter) stenosis within the access.285,364,369-371 In general, the interval that is present to correct the lesion in grafts before the access thromboses varies inversely with the access flow, being less than 8 weeks at a flow less than 450 mL/min371 and 3 months at flow rates of 600 to 800 mL/min.285
Although many centers refer patients directly for angiographic study without intermediate studies when a critical value is obtained, there may be a role for DDU anatomic scanning.282 Because fistulae maintain patency at lower flows than grafts, criteria for intervention in fistulae are not as well established. Values of 400 to 650 mL/min have been proposed. Higher values increase sensitivity, but lose specificity. Some fistulae can maintain patency for years at flows less than 400 mL/min, but with high-efficiency/high-flux dialysis, the treatment time requires extension. Conversely, intervention with PTA almost invariably triggers a process of repeated need for PTA because the frequency of at least 1 abnormality in an access is so high. Optimal care of a particular patient requires individualization, and not rigid application of protocols.
Because the development and severity of stenosis evolve to varying degrees among patients over time, the likelihood of detecting a hemodynamically significant stenosis increases if the surveillance test is repeated frequently. Therefore, surveillance should be performed at intervals of 1 month or less—depending on the complexity and cost—to detect access dysfunction early and permit sufficient lead time for intervention. The Work Group concluded that trend analysis could be as important as any individual value for any monitoring technique. Because access pressure measurements do not require complex technology, their frequency should be greater than that for access flow measurements. For direct measurement of access pressure, a frequency of twice a month appears sufficient. With methods more likely to produce variation under real-world clinical practice conditions (such as those from the HD system transducers), measurements once every 1 to 2 weeks are needed to detect a trend. The Work Group believes that measurement of static pressures every 2 weeks is the minimum frequency that is compatible with current HD staffing patterns. Derived static pressures need analysis from all available treatments for the month. Dynamic pressures should not be performed in grafts.
Measurement of access flow also was shown to be a valuable tool in determining the success of a therapeutic intervention. Failure to increase access flow by at least 20% after an intervention reflects failure of the intervention to correct the underlying problem.282,369 In 1 study, values before PTA and ∆QA correlated with the subsequent decrease in QA (P < 0.005).282 It was observed that QA increased after PTA (from 371 mL/min to 670 mL/min in a total of 65 grafts and 33 fistulae), but in a substantial percentage of cases, not to levels greater than 600 mL/min. QA values before PTA and the increase in QA values correlated with long-term outcomes, whereas angiographic results did not. Unfortunately, in many of the studies, the literature has admixed results for flow and outcome for both fistula and graft, making it impossible to sort out effects in grafts as opposed to fistulae. The Work Group believes there may be important differences in the response of fistulae (compared with grafts) to PTA, and surgical approaches also may influence outcomes. Research is needed in this area.
A large number of studies that used historical control data showed that prospective surveillance/monitoring to detect stenosis reduces the rate of thrombosis, although at the expense of increased procedures.10,322,343,373,374 A seminal study showed that a prospective program of dynamic pressure surveillance could detect stenotic lesions, reduce thrombosis rates, and reduce access replacement rates.322 In that study, fistulae and grafts were not differentiated with respect to efficiency of the test. Unfortunately, criteria developed with needles designed for low-efficiency dialysis (16 G; pressure > 150 mm Hg at a flow of 200 mL/min) were not adapted for larger bore needles (15 G and 14 G), and other investigators did not independently standardize their pressure criteria for the flow actually used (150 to 225 mL/min). Accordingly, results of this study generally were not duplicated.340 Until such standardization is performed, DVP alone is not recommended. Additional studies using static pressure,10 physical examination alone,352,353 DVP combined with access recirculation plus physical finding,373 DDU,284,374 and QA341,366,369,375 all showed a 41% to 67% reduction in thrombosis rate in grafts. A review suggested that the effect may be smaller in fistulae.374
Receiver operating characteristic (ROC) curve analyses have been performed to assess the overall performance of access flow and pressure in predicting thrombosis. Although in some studies, a good AUC of 0.84 to 0.9 was achieved for access flow, overall AUC for 10 studies was only 0.7.376 Addition of a change in flow increased AUC slightly to 0.82, but not to the value of 0.9 that an excellent test would produce (90% sensitive and 80% specific).377 The sum of QAand ∆QAdid not perform any better than PIA/MAP.
Unfortunately, the high baseline rate of thrombosis in grafts precludes a sensitive test that can unequivocally predict the likelihood of thrombosis or not over a specified time. During a 3-month observation period, grafts can clot in the absence of any stenosis and do so at flows equal to those that remain patent, 1,209 versus 1,121 mL/min.270 In these cases, PIA remains unchanged. Grafts that required intervention or that thrombosed because of an anatomic lesion had much lower access flows, 656 mL/min and 609 mL/min, respectively. At flows greater than the threshold, the incidence of thrombosis may be as high as 20% per 6-month period.375 Even with flows in the highest quartile, greater than 1,395 mL/min, another study found a thrombosis rate of 9% during a period of 3 months (annualized risk, 36%).285 Until more studies are performed that examine the frequency of thrombosis in the absence of stenosis and the frequency of patency in the presence of arterial or venous stenosis, the debate will go on.378-381
At the present time, the development of a surveillance abnormality should be correlated with other findings on physical examination and adequacy of HD. Any abnormality (QA, PIA) must be confirmed before further referral for either DDU (stenosis characterization) or angiography.
Randomized Trials of Preemptive PTA in Response to Surveillance
To date, only a small number of studies have been performed prospectively to assess the impact of surveillance on outcome. These are summarized in Table 16.
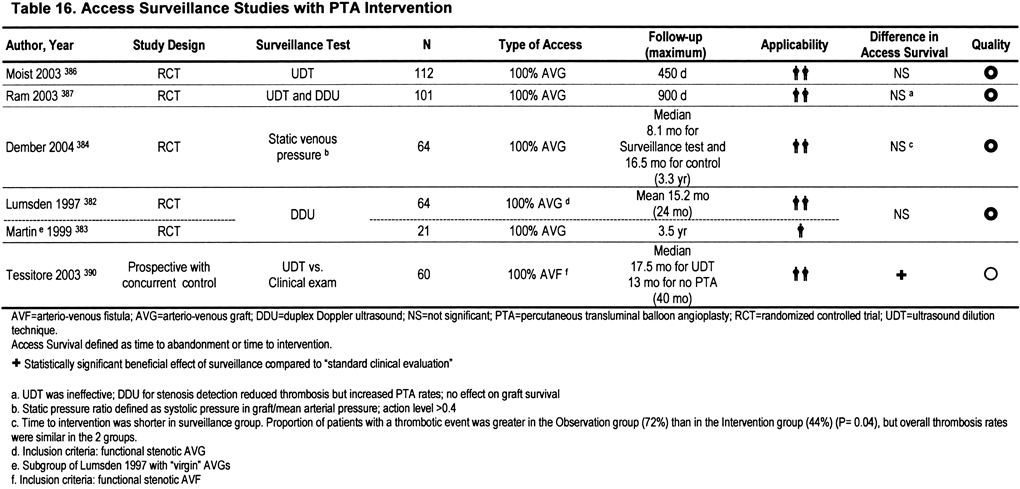
The concept that prophylactic or preemptive PTA would decrease graft thrombosis initially was refuted.382 In a study of 64 patients identified to have a 50% stenosis by using DDU and confirmed by using angiography, preemptive PTA produced no change in 6-month or 12-month patency. Because of confounding issues, a subanalysis was performed on 21 “virgin” grafts that had not previously clotted or required intervention.383 Preemptive PTA from the time of diagnosis of stenosis reduced the thrombosis rate from 0.44 to 0.10 episodes/patient-year at risk. Both rates were much less than the rate of 0.91 in patients without virgin grafts. However, sample size was small (n = 19). It should be noted that in this study, only anatomic assessment was obtained; no hemodynamic assessment was performed.
The small number of patients in this and all other prospective studies has limited assessment of efficacy. One prospective study using PIA was performed.384 Although the study itself was well designed, it was flawed by the surveillance technique. A preliminary study was performed in which monthly static venous pressure measurements were made during 2 consecutive HD sessions in all patients with a functioning upper-extremity graft in 2 HD units during a 16-month period. The method for deriving PIA ratio differed significantly from that originally described10 in that the ratio of systolic PIA pressure to MAP was calculated instead of the ratio of systolic PIA pressure/systolic blood pressure.385 The net effect of this error is that the ratio would have been falsely elevated and the threshold value of 0.4 would not apply. In addition, measurements were performed less frequently than recommended. Not surprisingly, ROC analysis yielded curves with areas less than 0.64.383 Subsequently, 64 patients with “elevated static venous pressure” measured in an upper-extremity graft were randomized to intervention (underwent angiography and repair of identified stenoses) or observation (underwent stenosis repair only in the event of access thrombosis or clinical evidence of access dysfunction), with the primary end point being access abandonment. Information on the fraction in the interventional group who had a stenosis is not provided. There was no difference in access abandonment (14 patients in each group) during the 3.5-year study period or in time to access abandonment. However, the proportion of patients with a thrombotic event was greater in the observation group (72%) than the intervention group (44%; P = 0.04), but overall thrombosis rates were similar in the groups (ie, there was a difference in mean number of thrombosis per graft in the intervention group in grafts that did thrombose). Not detailed was the number of PTAs that had to be performed in both groups during the entire study period.
Two randomized studies examined the role of access surveillance by using QA. In the first, it was found that stenotic lesions are detected more commonly by using QA (QA< 650 mL/min or 20% decrease in QA) than “routine surveillance” (physical examination plus DVP > 150 mm Hg) in a total of 112 patients, but elective PTA for lesions greater than 50% did not alter thrombosis rate.386 Rates of graft loss, times to graft loss, and overall thrombosis rates did not differ between the 2 groups. However, interventions increased by 30% in the intervention group. In the second study, 101 patients were randomized to 3 groups: control, low surveillance QA (Transonics) monthly, or stenosis detection by using DDU quarterly.387 Referral for angiogram was based on clinical characteristics in all, less than 600 mL/min in QA, and greater than 50% diameter in the DDU stenosis groups. QA was measured in all 3 groups, but only used for referral in the flow surveillance group. Baseline thrombosis rates were 0.7 and 0.9/patient-year in the control and QA groups, respectively. Results showed that QA increased PTA rate marginally (from 0.22 to 0.33/patient-year) and had no effect on thrombosis rate. Stenosis surveillance increased PTA to 0.65/patient-year and reduced thrombosis rates to 0.5/patient-year, but did not affect 2-year survival rate. QA less than 600 mL/min was found in 4 of 18, 4 of 31, and 3 of 11 in the control, QA, and stenosis groups in grafts that clotted (overall, 11 of 60). However, 26 of 35 in the stenosis group underwent PTA for “stenosis.” In both studies, 20% to 25% of accesses clotted without a surveillance abnormality, ie, in a totally unexpected manner.
However, the overriding conclusion of the studies that surveillance using QA and PTA in response to a threshold value of QA did not alter graft survival has to be tempered by the small sample size of the studies, the comparator used, and the efficacy of the intervention. Graft survival studies require a sample size of approximately 700 patients to detect an increase in graft survival of 1 year or a 33% difference in survival by 3 years (H. Feldman, personal communication). None of the studies had 20% of this number. It also is important to assess the skill level of the staff. If the staff can reach a positive predictive value of 80% (when stenosis is present and needs intervention) through use of physical examination and clinical characteristics (monitoring), use of a surveillance method that has a sensitivity of only 80% will produce no benefit over good monitoring. Determining which lesions should undergo correction has already been addressed. Elastic recoil needs to be assessed.
In contrast to grafts, the role of QA surveillance appears to be more established in fistulae. In 1 study, the positive predictive value, negative predictive value, sensitivity, and specificity of ultrafiltration method for vascular access stenosis (OABF CritLine III) were 84.2%, 93.5%, 84.2%, and 93.5%, respectively. Vascular access thrombosis rates in 50 QA surveillance patients were less (2 of 50 patients; 4%) than in 94 patients not followed up with flow measurements (16 of 94 patients; 17%; P = 0.024).242
In a second study, a 5-year RCT of blood flow surveillance and preemptive repair of subclinical stenoses (1 or both of angioplasty and open surgery) with standard monitoring and intervention based upon clinical criteria alone was carried out in Italy.388 Surveillance with blood pump flow (QB) monitoring during HD sessions and quarterly QA or recirculation measurements identified 79 fistulae with angiographically proven significant (>50% diameter) stenosis that were then randomized to either a control group (intervention done in response to a decrease in delivered dialysis dose or thrombosis; n = 36) or preemptive treatment group (n = 43). Kaplan-Meier analysis showed that preemptive treatment decreased the failure rate (P = 0.003) and the Cox hazards model identified treatment (P = 0.009) and greater baseline QA (P = 0.001) as the only variables associated with favorable outcome. Access survival was significantly greater in preemptively treated than control fistulae (P = 0.050), with greater postintervention QA as the only variable associated with improved access longevity (P = 0.044). This study provides evidence that active blood flow surveillance and preemptive repair of subclinical stenosis reduce the thrombosis rate and prolong the functional life of mature forearm fistulae and that QA greater than 350 mL/min before intervention portends a superior outcome with preemptive action in fistulae.
Finally, in a third study, a prospective controlled open trial to evaluate whether prophylactic PTA of stenosis not associated with access dysfunction improves survival in native virgin radiocephalic forearm fistulae, 62 stenotic functioning fistulae (ie, able to provide adequate dose of dialysis) were enrolled: 30 were allocated to control, and 32, to PTA.389 Kaplan-Meier analysis showed that PTA improved fistula functional failure-free survival rates (P = 0.012) with a 4-fold increase in median survival and a 2.87-fold decrease in risk for failure. A Cox proportional hazards model identified PTA as the only variable associated with outcome (P = 0.012). It was found that PTA increased QA by 323 mL/min (P < 0.001), suggesting that improved fistula survival is the result of increased access flow. PTA also was associated with a significant decrease in access-related morbidity, halving the risk for hospitalization, central venous catheterization, and thrombectomy (P < 0.05). Because prophylactic PTA of stenosis in functioning forearm fistulae improves access survival and decreases access-related morbidity, it supports the use of a surveillance program for the early detection of these stenoses.
At present, a vascular surveillance program to identify patients who may benefit from angiography and PTA appears to offer the most likelihood of benefit and may reduce thrombosis rates. However, we need additional studies to examine the characteristics of stenoses that produce incomplete responses to PTA so that patients are adequately treated at the time of their interventions.