Normal growth and development are major goals of pediatric CKD management. Because adequate nutritional status is important in achieving these goals, careful monitoring of nutritional status is essential. Nutritional status is a complex concept that cannot be adequately summarized by a single measurement. Multiple measures, considered collectively, are required to give a complete and accurate picture of nutritional status. Growth parameters are particularly important in children and should be accurately measured using calibrated equipment and standardized techniques (see Appendix 1).
1.1 The nutritional status and growth of all children with CKD stages 2 to 5 and 5D should be evaluated on a periodic basis. (A)
1.2 The following parameters of nutritional status and growth should be considered in combination for evaluation in children with CKD stages 2 to 5 and 5D. (B)
i Dietary intake (3-day diet record or three 24-hour dietary recalls)
ii Length- or height-for-age percentile or standard deviation score(SDS)
iii Length or height velocity-for-age percentile or SDS
iv Estimated dry weight and weight-for-age percentile or SDS
v BMI-for-height-age percentile or SDS
vi Head circumference-for-age percentile or SDS (≤3 years old only)
vii Normalized protein catabolic rate (nPCR) in hemodialyzed adolescents with CKD stage 5D.
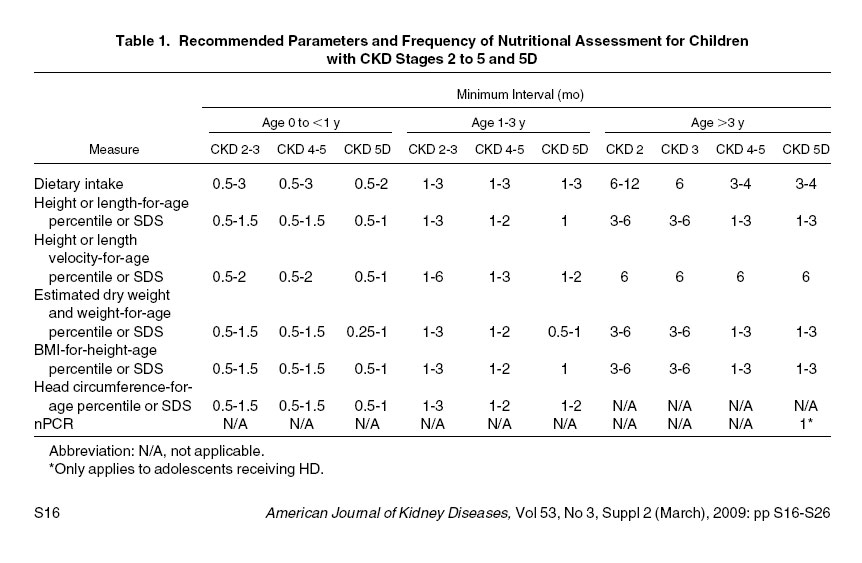
1.3 It is suggested that the frequency of monitoring nutritional and growth parameters in all children with CKD stages 2 to 5 and 5D be based on the child's age and stage of CKD (Table 1). (C) In general, it is suggested that assessments be performed at least twice as frequently as they would be performed in a healthy child of the same age. (C) Infants and children with polyuria, evidence of growth delay, decreasing or low BMI, comorbidities influencing growth or nutrient intake, or recent acute changes in medical status or dietary intake may warrant more frequent evaluation. (C)
1.1: The nutritional status and growth of all children with CKD stages 2 to 5 and 5D should be evaluated on a periodic basis. (A)
1.2: The following parameters of nutritional status and growth should be considered in combination for evaluation in children with CKD stages 2 to 5 and 5D. (B)
Because of the high prevalence of growth retardation in children with CKD, nutrition has always been a primary focus of pediatric CKD care. Early studies emphasized the importance of adequate energy intake in maintaining normal growth in pediatric CKD. However, no study demonstrated a growth advantage to a caloric intake greater than about 75% of the RDA,2-4 which corresponds approximately to 100% of the EER in children older than 3 months. Interestingly, the prevalence of undernutrition in children with CKD is unknown. This is likely due, in part, to an inadequate definition of undernutrition in this population. In children with CKD, the prevalence of undernutrition has been demonstrated to vary widely—from 2% to 65%—depending on the definition used.5 In the general population, the World Health Organization (WHO) has defined undernutrition as weight-for-age, height-for-age, and weight-for-height 2 SDs or greater less than the Centers for Disease Control and Prevention (CDC) reference median,6 in recognition of the fact that long-term undernutrition may lead to wasting (low weight-for-height) and/or stunting (low height-for-age). However, this definition may be inappropriate in children with CKD. Whereas stunting can be reasonably attributed solely to long-term undernutrition in otherwise healthy children, the multifactorial cause of stunting in children with CKD makes it a poor choice as a definition of undernutrition in this group. In the CKD population, anthropometric definitions of undernutrition are complicated; consideration must be given to the appropriateness of measures for both age and height of the child.
Body composition has yet to be well characterized in pediatric CKD. Few high-quality studies are available in which measures of body composition were adequately adjusted for height and appropriately compared with a healthy reference population.7-12 Of these, lean mass deficits were observed in some studies,11 but not others.7 Fat mass appears to be increased relative to height in children with CKD.11 Preliminary evidence in small numbers of children suggests that use of growth hormone may result in lower fat mass and higher lean mass for height.11
Interpretation of many prior studies of nutrition and growth in pediatric CKD is difficult because most studies considered infants and older children together as a uniform group. There are reasons to believe that infants younger than 2 to 3 years behave very differently from older children. At a theoretical level, there are 2 main considerations. First, a much larger proportion of the daily energy requirement is devoted to growth in infants compared with older children. Second, growth is driven primarily by nutrition during infancy, whereas growth hormone and sex hormones have a dominant influence during childhood and adolescence, respectively.13-16 On a practical level, there is evidence to support the notion that infants and older children behave differently. Inadequate spontaneous calorie intake has been clearly demonstrated in infants with CKD17-19; energy intakes for older children usually are normal relative to body size.9 In studies separating children by age, weight-for-height indices, and BMI-for-age, z scores were low in younger children, but normal in older children.10,12 Lean mass deficits were also more likely in younger than older children.7,8,10 Routine calorie and/or protein supplementation have been shown to improve growth in infants with CKD.17-19 However, there is no clear evidence that routine nutritional supplements have a similar effect in older children.
Because of these differences between infants and older children, the present recommendations emphasize the importance of considering the age of the child when planning nutritional monitoring and interventions.
Historically, the main focus of malnutrition in children with CKD has been undernutrition; there is some evidence that obesity is beginning to be a problem in the CKD population.20-22
Dietary Intake
It is suggested that dietary intake be assessed regularly by a skilled registered dietitian by means of a 3-day diet diary. Three 24-hour recalls may be preferable in adolescents. Dietary intake data provide useful information about the quantity and quality of nutrients ingested. The 2 most practical and clinically feasible ways to determine usual daily intake are the prospective 3-day dietary diary and the retrospective 24-hour dietary recall. From either of these, daily intake of calories, macronutrients (carbohydrate, protein, and fat), vitamins, and minerals can be estimated. Each of the methods has its own limitations. Dietary diaries have been shown to give unbiased estimates of energy intake in normal-weight children younger than 10 years; however, underreporting is common in adolescents.23,24 Twenty-four–hour recalls may be better suited to adolescents. The most important limitation of the 24-hour recall method is its poor ability to capture the day-to-day variability in dietary intake. Children may be even more susceptible to this limitation than adults because they tend to have more day-to-day variability.25 It may be useful to obtain three 24-hour recalls to more completely evaluate the food-intake pattern. One weekend day should be included in a 3-day diet diary and as 1 of three 24-hour recalls. Despite their limitations, dietary recall interviews conducted by a skilled pediatric registered dietitian or dietary diaries completed by the patient and/or parent as instructed by a registered dietitian provide useful general information about the pattern of food intake. Information about dietary intake allows the treating team to evaluate the adequacy of a patient's intake before significant adverse changes in body composition result.
Poor intake is expected in infants with CKD and should prompt immediate initiation of nutritional supplements if there is any evidence of inadequate weight gain or growth. When spontaneous intake is low in a poorly growing older child, consideration also must be given to the possibility that the poor intake is a result of the poor growth, rather than the cause. Spontaneous calorie intake increased by almost 12% in a study of 33 children with CKD during treatment with rhGH.26
Length- or Height-for-Age Percentile or SDS
Length (infants < 2 years) or height (children > 2 years) should be measured regularly, plotted on the length- or height-for-age curves, and the percentile and/or SDS should be calculated (Appendix 2, Table 32). Growth retardation is common in CKD.2,3,12,27,28 The impact of CKD on growth depends on both the degree of kidney impairment and age of the child. Normal growth can be divided into 3 phases: infancy (dominated by nutrition), childhood (dominated by growth hormone), and puberty (dominated by sex hormones).13 The infancy phase normally is replaced by the childhood pattern between 6 and 12 months of age. In CKD, onset of the childhood phase frequently is delayed until 2 to 3 years of age or interrupted by a transient resumption of the infancy pattern.13 CKD also results in a delay in the onset of pubertal growth, as well as a shorter pubertal growth spurt.29 Together, these alterations to the normal pattern of growth may lead to severe short stature. The typical CKD growth pattern is characterized by decreased growth velocity during infancy, followed by normal growth velocity during childhood and impaired growth velocity again during adolescence.16 However, growth velocity also may be low during the childhood phase in children with CKD stages 4 or 5.3,30 Numerous factors may influence growth in CKD, including acidosis,31 disturbances in the growth hormone axis,32 and poor nutritional intake.2 Nutritional intake has its greatest influence during the infancy phase of growth.16
Length (infants) should be measured by using a length board, and height (older children), by using a wall-mounted stadiometer, preferably by the same well-trained person at each assessment. Calculating the SDS or plotting the child's height on the normal growth chart to determine the percentile allows comparison with healthy children. In 2000, the CDC published revised North American growth reference charts for infants and children up to 20 years of age (Figs 11 to 14).33 In 2006, the WHO released new growth standards for children from birth to 5 years of age (Figs 1 to 10).34 These growth standards are distinguished from the CDC reference charts in 2 important ways. First, the children contributing to the WHO Growth Standards were specifically selected to represent children growing under ideal conditions: they had nonsmoking mothers, were from areas of high socioeconomic status, and received regular pediatric health care, including immunizations. A subset of 882 infants, all breastfed for at least 4 months, provided longitudinal data for 24 months. Second, the study population was of broad ethnic diversity; participants were recruited from Brazil, Ghana, India, Norway, Oman, and the United States. Importantly, ethnicity had very little impact on growth, indicating that the growth standards reflect a reasonable expectation for growth regardless of ethnicity; only 3% of the variability in growth within the population could be attributed to country of origin.34
Because the WHO Growth Standards represent ideal growth and ideal growth should be the goal for children with CKD, the WHO Growth Standards should be used as the reference for children from birth to 2 years. Differences between the CDC reference curves and the WHO Growth Standards are minimal after 2 years. For this reason and because the switch is made from length to height measurement at 2 years, 2 years appears to be a reasonable age to make the transition from the WHO Growth Standards to the CDC reference curves (www.rcpch.ac.uk/doc.aspx?id_Resource=2862; last accessed October 23, 2008).
It may be useful to consider the genetic height potential of the child when assessing adequacy of growth. Although the exact contribution of heredity cannot be calculated, an estimate of a child's adult height potential can be made by calculating midparental height adjusted for the sex of the child. Midparental height is calculated as follows (see Appendix 2, Table 33 for an online calculator):
The midparental height is plotted on the growth chart (of the same gender as the child) at 20 years of age. For both girls and boys, 3.5 inches (8.5 cm) on either side of this calculated value (target height) represents the 3rd to 97th percentiles for anticipated adult height.35 The 5 inches (13 cm) represents the average difference in height of men and women; thus, the child grows, on average, to the midparental height percentile.
Adequate growth is a good indication of adequate nutrition over the long term. However, acute weight loss may be severe and alterations in body composition may be substantial before linear growth is impaired. Growth usually continues at a normal rate in malnourished children until significant wasting occurs.36 For this reason, additional measures of nutritional status are advised.
Length or Height Velocity-for-Age Percentile or SDS
The growth velocity (change in height per unit of time) can be determined by recording serial height measurements. In children younger than 2 years, the change in length percentile and/or SDS will give an idea of growth velocity (a negative change indicates poor growth; a positive change may represent catch-up growth). Calculation of growth velocity percentile and/or SDS for children younger than 2 years can be done by using data from the 2006 WHO Growth Standards. Height velocity percentile and/or SDS can be calculated for children older than 2 years by using reference data from the Fels Longitudinal Study.37 It is important to recognize that height velocity cannot be accurately assessed for intervals shorter than 6 months in those older than 2 years. However, more frequent height measurements allow a running look at growth and give a general impression of its adequacy.
Estimated Dry Weight and Weight-for-Age Percentile or SDS
Euvolemic weight should be determined regularly. The weight should be plotted on the weight-for-age curves, and the percentile and/or SDS should be calculated. Weight is an important part of any nutritional assessment. In CKD, it is important to ensure that weight is measured in a euvolemic state. This generally is referred to as “dry weight” because fluid overload is common in those with CKD stage 5. Children with chronic nephrotic syndrome also may have fluid overload, even at milder stages of CKD. Fluid overload will influence not just weight, but also may affect other anthropometric measures, such as arm circumference and skinfold thicknesses.38,39 Volume depletion also may be present in some conditions resulting in pediatric CKD (dysplasia, obstructive nephropathy, and cystinosis). It is equally important that the euvolemic weight be considered in these cases. The estimated dry weight can be challenging to ascertain because weight gain is expected in growing children. Five parameters are helpful in the estimation process: weight, presence of edema, blood pressure, certain laboratory values, and dietary interview. The midweek postdialysis weight and the combination of noninvasive blood volume monitoring and the postdialytic vascular compartment refilling rate are used for evaluation purposes in an HD patient.40 The weight at a monthly visit (minus dialysis fluid in the peritoneal cavity) is used for the child on PD therapy. The estimated dry weight is challenging to evaluate in patients prone to edema and must be done in conjunction with a physical examination. Excess fluid may be visible in the periorbital, pedal, and other regions of the body. Hypertension that resolves with dialysis can be indicative of excess fluid weight. Other responses to dialytic fluid removal, such as cramping or hypotension, may also give clues about the fluid status of the patient. Decreased serum sodium and albumin levels may be markers of overhydration. Rapid weight gain in the absence of a significant increase in energy intake or decrease in physical activity must be evaluated critically before it is assumed to be dry weight gain.
After the dry weight has been determined, it should be used to calculate the BMI and determine the weight-for-age percentile and/or SDS (or be plotted on the weight-for-age curves). As noted in the section on height, the 2006 WHO Growth Standards should be used as the reference for children up to 2 years; the 2000 CDC growth charts should be used for children older than 2 years. It is important to recognize that the weight-for-age SDS is not particularly useful in isolation—weight-for-age will be low in growth-retarded children. Rather, it should be interpreted in the context of the height-for-age SDS.
BMI-for-Height-Age Percentile or SDS
It is suggested that BMI be determined each time height and weight are measured. BMI should be plotted on the sex-specific BMI-for-age curves, and the percentile and/or SDS should be calculated. BMI is an accepted and easily calculated method of evaluating weight relative to height. However, BMI, calculated as weight (kg) divided by height (m) squared is not completely independent of either age or height. This is explained in part by age-related changes in body proportions and in part by mathematics: a 1-dimensional measure (height) will predict a 3-dimensional measure (increasing weight represents body growth in 3 dimensions) to the third power, not the second power.41 The solution has been to express BMI relative to age in developing children.42 In this relation, age functions as a surrogate for both height and maturation. Because height, age, and maturation are highly correlated in healthy children, this approach works reasonably well. Sex-specific BMI-for-age reference data permit calculation of BMI-for-age z scores or percentiles, allowing meaningful and consistent interpretation of BMI in normal children regardless of age. In children with kidney disease, in whom growth retardation and delayed maturation are common, this approach has limitations. Expressing BMI relative to chronological age in a child with growth and/or maturational delay will result in inappropriate underestimation of his or her BMI compared with peers of similar height and developmental age. To avoid this problem, it may preferable to express BMI relative to height-age in children with CKD—that is, the age at which the child's height would be on the 50th percentile.38,523 This approach ensures that children with CKD are compared with the most appropriate reference group: those of similar height and maturation.
Height-age is believed to provide a reasonable surrogate for maturation in most children (ie, the age at which a child would be at the 50th percentile for height likely is close to the age at which most healthy children would have a similar level of sexual/physical development). Similarly, in children with short stature, expressing BMI relative to height-age will minimize errors that may occur as a result of the correlation between BMI-for-age and height-for-age. However, caution must be used in applying this approach to children outside the pubertal or peripubertal period, for whom the correlation between height-age and maturation is less clear. BMI relative to chronological age may be more logical in some cases, particularly when sexual maturation is complete.
Although the weight-for-height index is a meaningful measure during early and midchildhood, BMI has the advantage of being applicable throughout the lifespan, from infancy to adulthood, and is becoming the standard method of assessing weight relative to height.43 While BMI-for-age charts are now available from birth onwards, clinical experience in using and interpreting BMI before 24 months of age is limited, as are data on its association with current or future morbidity and for this reason, BMI is suggested rather than weight-for-height index after the age of 2 years.
The CDC defines underweight as a BMI-for-age less than the 5th percentile (www.cdc.gov/nccdphp/dnpa/growthcharts/training/modules/module1/text/page5a.htm; last accessed February 1, 2008).44 A BMI-for-age greater than or equal to the 85th percentile is considered overweight, and greater than the 95th percentile, obese.45 The WHO definitions of underweight differ somewhat from those used by the CDC. A BMI-for-age SDS of -2.0 (BMI-for-age ~ < 3rd percentile) recently has been proposed as a cutoff to define underweight or “thinness” in children. This definition is attractive because it corresponds to the cutoff for grade 2 thinness in adults (BMI, 17 kg/m2).43 However, no high-quality studies are available linking BMI less than a certain cutoff to poor outcomes in the general population. Therefore, no evidence-based definitions of undernutrition or “thinness” exist. Furthermore, the applicability of such definitions to the CKD population is unknown. Two large studies of adult HD patients demonstrated an inverse relationship between BMI and mortality risk, with no clear BMI threshold above which the risk stabilized or began to increase; mortality risk continued to decrease even as BMI increased to greater than 30 kg/m2.46,47 A smaller study of adult HD patients suggested increased mortality risk with BMI less than 17 and BMI greater than 23 kg/m2 compared with those with BMI between 17.0 and 18.9 kg/m2.48 In children with stage 5 CKD, a U-shaped association was demonstrated between BMI-for-age SDS and mortality risk. Children with a BMI SDS either greater or less than 0.50 had a greater risk of mortality than those with a BMI SDS of 0.5; each 1.0-SD unit difference in BMI SDS was associated with a 6% greater risk of mortality.49 It is important to recognize that this study only demonstrated an association between BMI and mortality, but could not establish a causal relationship. Furthermore, the additional mortality risk associated with BMI SDS greater or less than 0.5 was small.
Interpretability of BMI may be limited in the CKD population due to fluid overload. Clearly, any excess fluid will artificially increase BMI. Fluid overload representing 10% of the body weight will result in a BMI SDS approximately 0.5 to 1.0 SD units greater than what it would be at dry weight. Therefore, efforts should be made to use only a true dry weight when calculating BMI.
High-quality reference values for BMI relative to age are now available throughout childhood. The 2000 CDC revised growth charts include sex-specific BMI-for-age curves for children and adolescents between 2 and 20 years of age.33 These curves, developed using a North American population, provide a contemporary BMI reference that recognizes the dependence of BMI on age and allow calculation of BMI-for-age SDS and percentiles. The 2006 WHO Growth Standards also include BMI standards for children from birth to 5 years of age (www.who.int/childgrowth/standards/technical_report/en/index.html; last accessed October 23, 2008).34 Together, the WHO Growth Standards and the CDC growth charts provide reference values for BMI from birth to adulthood. As for length and height measures, BMI should be compared with the WHO Growth Standards up to 2 years of age and with the CDC growth charts thereafter (www.rcpch.ac.uk/doc.aspx?id_Resource=2862; last accessed October 23, 2008).
Head Circumference-for-Age Percentile or SDS
Head circumference should be measured regularly in children 3 years and younger. Head circumference should be plotted on the head circumference-for-age curves. Poor head growth is well documented in children with CKD,50,51 with infants at highest risk. Although no studies have specifically related head circumference to nutritional status in CKD, regular measurements of head circumference in conjunction with intermittent developmental assessments are an important part of routine pediatric CKD care. The 2007 WHO Growth Standards should be used as a reference.52
Normalized Protein Catabolic Rate
PEM may have profound effects on growth and development and may be associated with increased risk of morbidity and mortality.
Protein catabolic rate (PCR) has been studied as an objective measure of DPI in stable patients receiving maintenance HD. PCR can be normalized to a patient's weight (nPCR); nPCR initially was studied in the 1980s as a marker of DPI in pediatric HD patients assumed to be in stable nitrogen balance.53 Calculation of nPCR is based upon the increase in blood urea nitrogen (BUN) level from the end of 1 HD treatment to the beginning of the next treatment to calculate the urea generation rate (G; mg/min). nPCR originally was calculated by using formal urea kinetic modeling in association with Kt/V calculations.54 Recent pediatric data demonstrate that algebraic formulas yield nearly identical nPCR results compared with formal urea kinetic modeling.55 The algebraic nPCR calculation is as follows:
G (mg/min) = [(C2 × V2) - (C1 × V1 )]/t
where C1 is postdialysis BUN (mg/dL), C2 is predialysis BUN (mg/dL), V1 is postdialysis total-body water (dL; V1 = 5.8 dL/kg × postdialysis weight in kg), V2 is predialysis total-body water (dL; V2 = 5.8 dL/kg × predialysis weight in kg), and t is time (minutes) from the end of the dialysis treatment to the beginning of the following treatment.
Then, nPCR is calculated by using the modified Borah equation56:
nPCR = 5.43 × estG/V1 + 0.17
where V1 is total-body water (L) postdialysis (0.58 × weight in kg).
Data from adult studies demonstrate that the pre- and postdialysis BUN levels from the same treatment can be used to calculate nPCR; additional blood sampling from the next treatment is not necessary.57 Recent pediatric data demonstrated increases in nPCR in malnourished children on HD therapy who received IDPN. In these studies, higher nPCR was associated with subsequent weight gain, whereas lower nPCR predicted future weight loss in adolescents.58,59
Comparison of nPCR versus serum albumin level in an entire single-center population, irrespective of nutrition status, showed that nPCR less than 1 g/kg/d of protein predicted a sustained weight loss of at least 2% per month for 3 consecutive months in adolescent and young adult–aged patients,60 whereas serum albumin levels could not. In younger pediatric HD patients, neither nPCR nor serum albumin level was effective in predicting weight loss. This potentially could be explained by: (1) better nutritional status in infants and toddlers who are more likely to be tube fed, (2) a greater contribution of unmeasured urine urea clearance, (3) differences in protein catabolism, and/or (4) different growth rates in younger children compared with older children. It is also possible that because nPCR was derived in adult patients receiving HD, nPCR may be a valid measure only for patients of adult age or size.
Although no data exist to guide recommended optimal nPCR measurement frequency in HD patients, the same data needed for Kt/V calculation allow for nPCR calculation without additional blood sampling. Thus, nPCR can be monitored monthly along with Kt/V to follow up trends for a particular patient and provide an objective measure of protein intake.61 The K/DOQI Adult Nutrition Guidelines recommend monthly assessment of nPCR for maintenance HD patients.62 It is suggested that nPCR level be targeted to the age-specific protein intake guidelines noted in Recommendation 5.
In a manner similar to the evaluation of nPCR in patients receiving HD, it is recommended that the DPI of adults receiving PD be estimated several times per year by determination of the protein equivalent of nitrogen appearance (PNA).63 This is calculated by measuring the urea nitrogen content of urine and dialysate, which represents the total nitrogen appearance (TNA), and multiplying that value by 6.25 (there are ~6.25 g of protein per 1 g of nitrogen).64 Although limited data for this subject are available in pediatrics and the assessment is not regularly carried out in pediatric dialysis centers, Mendley and Majkowski65 defined the relationship between urea nitrogen and TNA in children undergoing PD as follows:
TNA (g/d) = 1.03 (urea nitrogen appearance)
+ 0.02 (weight in kg) + 0.56
(for subjects age 0 to 5 years)
or 0.98 (for subjects age 6 to 15 years)
Patient age was taken into consideration because of its relationship to dialysate protein loss.
Edefonti et al66 later reported that incorporating dialysate protein nitrogen and body surface area (BSA) in the formula could improve the prediction of TNA. Their recommended formula is as follows:
TNA (g/d) = 0.03 + 1.138 urea-Nurine
+ 0.99 urea-Ndialysate + 1.18 BSA
+ 0.965 protein-Ndialysate
Limitations of PNA are that it is valid only when the patient is not anabolic or catabolic, the value changes rapidly when DPI is altered and thus may not reflect usual protein intake, and it should be normalized for patient size, although the best parameter to use has not been determined. In adults, normalization to ideal weight is recommended.
Other Measures Considered
Serum albumin: Serum albumin was recommended in the 2000 K/DOQI Nutrition Guidelines as a marker of nutritional status. Hypoalbuminemia is a common finding in those with CKD and consistently has been associated with increased mortality in both adults46,67-69 and children with CKD.70 Because PEM may lead to hypoalbuminemia, serum albumin level generally has been considered a useful index of nutritional status. However, important limitations have been identified with respect to the ability of serum albumin level to function as a reliable marker of malnutrition in the setting of CKD.38,71-77 Serum albumin is depressed in the setting of both systemic inflammation and volume-overload states.73,74 In the absence of inflammatory markers, hypoalbuminemia is not predictive of increased mortality.77 Given the association of hypoalbuminemia with mortality, it remains an important component of the general evaluation of patients with CKD. However, the value of albumin as a marker of nutritional status is questionable. Hypoalbuminemia should lead to careful assessment of volume status and protein loss and to investigation for causes of systemic inflammation.
Mid-arm anthropometry: Mid-arm circumference (MAC) and triceps skinfold thickness (TSF) previously were recommended as part of the nutritional assessment in pediatric CKD.62 TSF was considered to reflect total fat mass, and the combination of TSF and MAC were used to calculate the mid-arm muscle circumference (MAMC) and mid-arm muscle area (MAMA), which are purported to reflect total muscle mass. These measures are no longer recommended as a part of routine assessment. There are 4 main problems with the use of these measures.
First, it is difficult to obtain reliable measurements, particularly in patients with CKD. Skinfold thickness measurement is extremely operator dependent and lacks precision, except in very experienced hands.78 In children with CKD, the presence of fluid overload may result in overestimates and poor reliability of skinfold thickness.38 MAC is easier to reliably measure than TSF, but is even more susceptible to overestimation due to fluid overload.38,39
Second, it is not clear that MAMC and MAMA are accurate reflections of total muscle mass, even in otherwise healthy individuals.38 The relationship between total muscle mass and MAMC or MAMA is even less clear in those with CKD. Abnormal regional distribution of lean tissue in patients with CKD79 may result in a breakdown in the relationship between MAMC or MAMA and total muscle mass. Furthermore, the potential errors associated with TSF and MAC due to fluid overload and distorted fat and lean distribution may be compounded when they are combined in equations to calculate MAMC and MAMA. Arm measures failed to reliably detect decreased lean mass as measured by using in vivo neutron activation analysis in at least 1 study of adult HD patients.80
Third, deficits in these parameters have never been described convincingly in children with CKD. Although arm measures have been reported to be low relative to age in prior studies of children with CKD, there is little evidence that deficits exist when appropriate adjustments were made for short stature. Given that children with CKD are often short for age, proportionally smaller arm circumferences and skinfold thicknesses are expected. Arm measures would be expressed more appropriately relative to height or height-age. When this has been done, deficits have been rare. In only 1 pediatric study in which TSF was adjusted appropriately for height were significant deficits in TSF seen—and only in younger children.12 The mean TSF-for-height-age z score was high at +0.9 in a study of 56 children with CKD.5 There is growing evidence that TSF and total fat mass are high relative to height in the CKD population. Mean total fat mass (determined by using dual-energy X-ray absorptiometry [DXA]) for height-age z score was +1.1 in 50 children with CKD stages 3 to 5.11 One study of PD patients found mean MAC-for-height-age z scores of −1.1 in 12 children younger than 10 years and −0.1 in 12 children older than 10 years.12 However, another study of 56 children with CKD stages 3 to 5 found a mean MAC-for-height-age z score of +0.4.5
Finally, few studies have investigated the link between TSF, MAC, MAMC, or MAMA and outcome in the CKD population. MAMC failed to be identified as an independent predictor of mortality in a 3-year longitudinal study of 128 adult HD patients.68
Dual-energy X-ray absorptiometry (DXA): A whole-body DXA scan provides excellent estimates of fat mass and lean mass.81 The main limitation of DXA in patients with CKD is that it is unable to distinguish normally hydrated from overhydrated lean tissue; thus, it may overestimate lean mass in volume-overloaded subjects. DXA has been used extensively for body-composition assessment in adults with CKD and in several small studies of children with CKD.11,82-86 Although deficits in lean mass relative to height-age have been demonstrated in children with CKD,11 there are insufficient data to support a recommendation for regular DXA scans in children with CKD. The added value of a DXA scan over such a simple and inexpensive measure as BMI has yet to be proved. Significant advantages associated with the extra information provided by DXA would need to be clearly demonstrated to justify the expense.
Bioelectrical impedance analysis (BIA): BIA allows estimation of body fluid compartment volumes, which may then be used to make inferences about body composition.87 However, despite extensive BIA studies, investigators have been unsuccessful at developing broadly applicable BIA methods that function well on the individual level.88-93 Margins of error are so large as to render results of dubious clinical value. Abnormalities in volume status probably are the biggest problem limiting the interpretability of BIA measures in children with CKD. All BIA measures, including impedance and phase angle,94-96 will change when either fluid status, fat mass, or lean mass changes. However, it is impossible to distinguish which change has occurred based on BIA measures.
Single-frequency whole-body BIA has been used in an effort to predict total-body water in children receiving maintenance dialysis.93 The BIA-derived total-body water estimates were compared with total-body water measured by means of isotope dilution (gold standard). Although the group mean total-body water measured by using bioimpedance was within 170 mL of that measured by using isotope dilution, limits of agreement were wide (±17% of the true value). This means that an individual subject with a true total-body water volume of 30 L could be estimated to have a total-body volume as high as 35.1 L or as low as 24.9 L by using BIA.
Multiple-frequency BIA (bioimpedance spectroscopy) allows direct estimation of both extracellular fluid (ECF) and intracellular fluid volumes,97 although estimates of ECF volumes are more accurate.98 A small study of children with mild-to-moderate chronic renal insufficiency used whole-body bioimpedance spectroscopy to successfully estimate ECF volume within 6% of that measured by using isotope dilution.91 Bioimpedance spectroscopy is a promising technique, particularly for estimating ECF, but it has not yet been adequately validated in children or adults with CKD.
Whole-body BIA has significant limitations when abnormalities in fluid distribution exist. The technique is insensitive to large changes in fluid volume in the trunk and very sensitive to small changes in the limbs.99 To avoid this problem, a segmental bioimpedance technique has been developed in which each of 5 body segments (2 arms, 2 legs, and trunk) are measured separately.99 In an effort to avoid overrepresentation of the limbs and underrepresentation of the trunk in the final total-volume calculation, impedance from each segment is given appropriate weight; this accounts for the different contributions of each segment to total resistance.99 This technique may be particularly useful in fluid-overloaded persons. However, it has not been validated in children.
A final potential application of BIA is to help determine whether an individual is euvolemic. Although promising techniques have been developed in this regard,100,101 these methods have not yet been tested in children.
Multiparameter nutritional assessment scales: Because no single parameter has been found that will identify all patients at nutritional risk, multiparameter indices of nutritional status have been developed in attempts to improve accuracy. Multi-item measures may increase reliability, scope, and precision compared with 1 individual objective measure.
One such index was developed specifically for children on PD therapy.102,103 Anthropometric and bioimpedance measures were combined to generate a score; however, the means by which the parameters were combined to arrive at a final score has limited justification and many of the component measures are highly correlated. Furthermore, the score is heavily influenced by single-frequency BIA measurements, which are of questionable value. The method does not appear practical for routine clinical practice.
Subjective Global Assessment (SGA), a method of nutritional assessment using clinical judgment rather than objective measures, has been widely used to assess nutritional status of adults with CKD104 for both clinical and research purposes. The clinician performing SGA considers 5 features of a medical-nutrition history (weight loss, dietary intake, gastrointestinal symptoms, functional capacity, and metabolic stress) and 4 features of a physical examination (subcutaneous fat loss, muscle wasting, edema, and ascites) to assign the patient an overall rating of well nourished, moderately malnourished, or severely malnourished without adhering to any kind of rigid scoring system.105,106 An SGA specifically for the pediatric population recently has been developed and validated in children undergoing major surgery.107 Applicability of this pediatric Subjective Global Nutrition Assessment (SGNA) in children with CKD is currently being studied.
Frequency of Assessment
1.3: It is suggested that the frequency of monitoring nutritional and growth parameters in all children with CKD stages 2 to 5 and 5D be based on the child's age and stage of CKD. (C) In general, it is suggested that assessments be performed at least twice as frequently as they would be performed in a healthy child of the same age. (C) Infants and children with polyuria, evidence of growth delay, decreasing or low BMI, comorbidities influencing growth or nutrient intake, or recent acute changes in medical status or dietary intake may warrant more frequent evaluation. (C)
The frequency with which a nutritional evaluation should be conducted depends on both the age of the child and the severity of CKD (Table 1). Current recommendations for measurement of growth parameters in healthy infants and children vary slightly by country. In general, 2 assessments are recommended in the first month, then monthly until 2 months of age, every 2 months until 6 months of age, every 3 months until 18 months of age, every 6 months until 2 years of age, and then yearly thereafter.108,109
Given that nutritional intake and growth may be impaired even with mild CKD in infants—and that these improve with nutritional supplementation17,18,110,111—it is suggested that growth parameters be monitored at least twice as frequently in infants with moderate CKD as is recommended for healthy infants. More frequent evaluations are required in infants with severe CKD (stages 4 to 5 and 5D). Early recognition of growth delay in infancy is crucial because growth failure in this critical period is extremely difficult to catch up later.16,30 Any evidence of retarded growth in an infant should prompt detailed dietary assessment and intervention.
In older children, the impact of CKD on growth and body fat and lean stores appears to depend to a large degree on the severity of CKD. A “dose-response” relationship between glomerular filtration rate (GFR) and BMI-for-age z score was noted in 1 study, with lower GFR associated with lower mean BMI-for-age z score.28 Again, given the risks of growth retardation in children with CKD, assessment of growth parameters is suggested to be performed at a minimum of every 6 months in children with CKD stages 2 to 3, ie, at least twice as often as recommended for healthy children. For children with more advanced CKD (stages 4 to 5 and 5D), more frequent evaluation may be warranted due to the greater risk of abnormalities. Every effort should be made to conduct nutritional status assessments when the child is euvolemic.
These recommendations represent the minimum intervals for assessment. More frequent evaluation may be warranted in children with evidence of growth delay, decreasing or low BMI, any comorbidities potentially influencing growth or nutrient intake, or recent acute changes in medical status or dietary intake. Three-day food records at intervals more frequent than every 3 to 6 months are not required for infants or children with good appetites, grossly adequate dietary intakes, and adequate weight gain. More frequent records are indicated when there is concern about the adequacy of a child's intake or overconsumption of 1 or more nutrients.
The Caring for Australasians with Renal Impairment (CARI) CKD Guidelines recommend assessment of dietary intake, height/length, weight, head circumference, and BMI at 1- to 3-month intervals and suggest that determination of SDS for the anthropometric measures is preferable to simply plotting on the percentile curve. They also suggest expressing BMI relative to height-age rather than chronological age. MAC and TSF are not recommended by CARI due to a lack of evidence supporting their use. The use of nPCR is not advocated for in the CARI nutrition guidelines, although these guidelines were established before many of the recent studies cited were published.
The European ad hoc Committee on Assessment of Growth and Nutritional Status in Peritoneal Dialysis recommends a nutritional assessment, including height/length, weight, head circumference, MAC, and BMI, at a minimum interval of every month in children younger than 5 years and every 2 months for older children. TSF is not recommended due to poor reliability. They suggest assessment of dietary intake at least every 6 months and more frequently in infants. Caution is advised in interpreting serum albumin levels due to their poor reliability in indicating undernutrition. DXA is considered a nonessential measurement tool; it is suggested no more often than yearly. BIA also is considered nonessential since concerns with interpretability of BIA measures are raised. It is suggested that BIA be used only in combination with other assessment methods.
The 2006 update of the KDOQI Pediatric HD Adequacy Guidelines recommends monthly nPCR assessment.63
Two main limitations with prior studies were identified. Many failed to distinguish older children from infants and very young children, in whom the impact of nutrition on growth and body composition may be quite different. Many prior studies also failed to account for CKD-related short stature when describing body composition, expressing measures relative to age rather than height. This resulted in overestimation of deficits in weight, fat and lean masses, and arm measures.