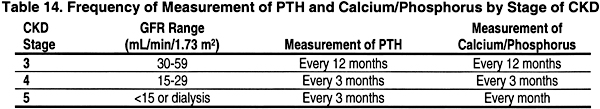
1.1 Serum levels of calcium, phosphorus, and intact plasma parathyroid hormone (PTH) should be measured in all patients with CKD and GFR <60 mL/min/1.73 m2. (EVIDENCE) The frequency of these measurements should be based on the stage of chronic kidney disease (Table 14). (OPINION)
1.2 These measurements should be made more frequently if the patient is receiving concomitant therapy for the abnormalities in the serum levels of calcium, phosphorus or PTH, as detailed in Guidelines 4, 5, 7, and 8 and in transplant recipient, Guideline 16.
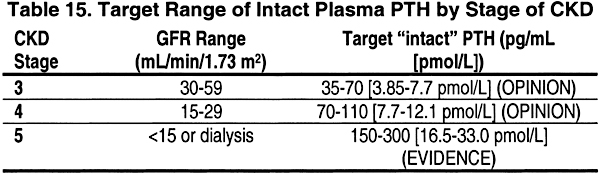
1.3 Measurement of plasma PTH levels may be done less frequently for those with levels within the low end of the target levels (Table 15). (OPINION)
1.4 The target range of plasma levels of intact PTH in the various stages of CKD are denoted in Table 15.
A disorder of bone remodeling, the osteodystrophy of CKD, is a common complication. By the time patients require dialysis replacement therapy, nearly all are affected. The onset of the disorder is detectable about the time 50% of kidney function is lost.17,18 There are multiple histological types of bone pathology in patients with CKD. At the present time, the ability to diagnose the exact type of osteodystrophy of CKD without the pathological description enabled by bone biopsy does not exist. Since high-turnover osteodystrophy can be prevented,19,20 patients with CKD should be monitored for imbalances in calcium and phosphate homeostasis, and for secondary hyperparathyroidism, by determination of serum calcium, phosphorus, and intact PTH levels.
Levels of intact parathyroid hormone as determined by immunoradiometric assay (IRMA) or immunochemiluminometric assay (ICMA) are an adequate screening tool to separate high-turnover bone disease (osteitis fibrosa) from low-turnover bone disorders (adynamic bone disorder).21-26 While the ability to discriminate between the histological types of osteodystrophy of CKD has been demonstrated with determination of blood levels of intact parathyroid hormone, the optimal target level for PTH in CKD is not known due to limitations in the available data, and the emerging consensus that those target levels may be lower than currently thought.27 Recent studies demonstrate that intact PTH assays overestimate the levels of biologically active PTH by detecting C-terminal fragments missing amino acids from the N-terminus of the molecule, which may have an inhibitory activity. Newer PTH assays have been developed to overcome this problem by using an antibody that detects the first several amino acids in a 2-site assay, but sufficient research has not accumulated to establish the predictive power of these newer assays, and whether they will overcome the shortfalls in the intact hormone assays. Furthermore, the newer assays have not as yet replaced the intact hormone assays as standard clinical tools.
The predictive power of parathyroid hormone levels is increased by concomitant consideration of alkaline phosphatase levels,28 although insufficient data exist to determine the sensitivity and specificity of alkaline phosphatase in osteodystrophy of CKD, or its concomitant use with parathyroid hormone levels. These studies were performed in the era of high osteomalacia prevalence, and it remains to be determined whether alkaline phosphatase determinations are additive to the newer PTH assays. Several other biochemical markers of bone turnover have been developed (osteocalcin, hydroxyproline) and are possibly useful in the evaluation and management of osteoporosis, but CKD affects each of these determinations, and no evidence of their usefulness in this population exists.28 No bone imaging methods exist for measuring bone disease that can be used diagnostically in place of bone biopsy for osteodystrophy of CKD.
Blood levels of PTH begin to rise when GFR falls below 60 mL/min/1.73 m2, and evidence of bone disease due to hyperparathyroidism may be present at Stage 3 of CKD (Fig. 4).

Fig 4. Graph showing relationship between serum I-PTH levels and CCR based on data extracted from Martinez et al (1997). Values on the y-axis are serum I-PTH levels (pg/mL). Values on the x-axis are CCR in mL/min. The lines fitted to the data set are based on 4 different mathematical functions (power, linear, exponential, and logarithmic), rather than on any assumptions about an underlying physiological mechanism. The horizontal line represents the upper limit of the normal range of serum I-PTH levels.
This secondary hyperparathyroidism progresses as kidney function worsens. During this process, changes in blood levels of serum phosphorus (hyperphosphatemia) and calcium (hypocalcemia) occur and contribute to the worsening of hyperparathyroidism and bone disease. Therefore, measurements of serum levels of phosphorus, calcium, and PTH should be made when GFR falls below 60 mL/min/1.73 m2 and these parameters should be monitored thereafter in patients with CKD (Table 14).
Most patients with kidney failure or those on maintenance dialysis have some form of osteodystrophy of CKD. Despite considerable advances in understanding the pathophysiology, prevention, and treatment of osteodystrophy of CKD, an adequate substitute for bone biopsy in establishing the histological type of osteodystrophy has not been developed. Standard bone radiography can reliably detect bone erosions, but has a sensitivity of approximately 60% and a specificity of 75% for the identification of osteitis fibrosa using such erosions (Fig 5). Skeletal radiography is therefore an inadequate test. Sufficient data to assess the sensitivity and specificity of other imaging methods in the diagnosis of osteodystrophy of CKD do not exist. Data on the assessment of the usefulness of quantitative computed tomography in the diagnosis of osteodystrophy of CKD are also insufficient. Standard radiography is more useful in the detection of vascular calcification than it is for osteodystrophy. Studies determining the sensitivity and specificity for detection of vascular calcification in CKD have not been performed, but the sensitivity is expected to be low. Recently, newer imaging techniques such as electron beam computed tomography (EBCT) and spiral CT have been developed to detect vascular calcification.29,30 These studies demonstrate an alarming and progressive vascular calcium burden during CKD and the treatment of kidney failure with replacement therapies. These techniques will likely become standard tools to monitor vascular calcification and its therapy.
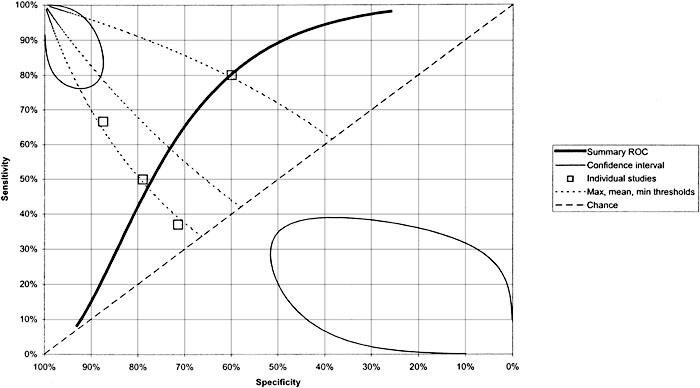
Fig 5. Summary ROC derived from 4 individual studies assessing the diagnostic characteristics of erosions on X-ray for diagnosis of osteitis fibrosa. Values on the y-axis are the diagnostics sensitivity and values on the x-axis are the diagnostics specificity. The more effective the test is as a diagnostic, the closer it falls to the upper left hand corner of the graph. The summary ROC curve and its 95% confidence interval provides a summary estimate of the performance of the test based on the meta-analytically combined results from all 4 studies. The mean threshold (indicated on the graph by a diamond icon) is the best point estimate of the sensitivity and specificity of erosions on X-ray for diagnosis of osteitis fibrosa.
There are very few studies with sufficient detail about diagnostic protocols to assess the usefulness of dual energy X-ray absorptiometry (DEXA) in the diagnosis of osteodystrophy of CKD. However, whole-body DEXA is a reliable, noninvasive method of assessing bone mineral density (BMD). Since BMD is helpful in the diagnosis of osteopenia and/or osteoporosis, and may assist in predicting risk for fractures, DEXA is a useful tool in assessing these abnormalities in CKD patients. Indeed, available data indicate that BMD decreases as CKD progresses (Fig 6).
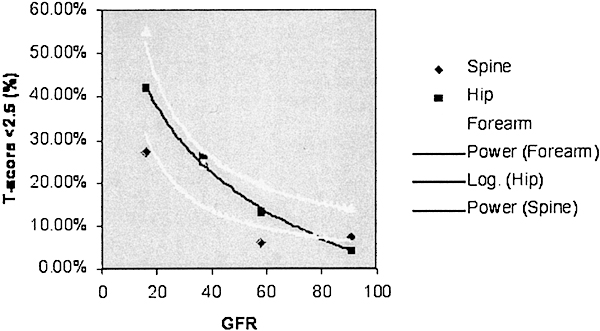
Fig 6. Graph showing relationship between prevalence of osteoporosis as a function of GFR based on data extracted from Rix et al (1999). Values on the y-axis are the prevalence of osteoporosis as defined by a T-Score less than -2.5. Values on the x-axis are midpoint values of GFR in mL/min. The lines fitted to each data set are empirical fits and are not based on any assumptions about an underlying physiological mechanism. Reproduced with permission.31
DEXA should be employed in CKD to monitor patients with fractures or those with known risk factors of osteoporosis. These include, but are not limited to: menopause, other causes of gonadal hormone deficiency, smoking, Caucasian race, age greater than 65, and medications such as glucocorticosteroids. Guidelines to treat osteoporosis in the general population are available at www.nof.org. Whether these Guidelines are applicable for the treatment of osteoporosis in CKD patients has not been established.
Multiple studies have been performed using intact PTH assays to diagnose high-turnover bone disorders and distinguish them from low-turnover disorders. A receiver operating characteristics (ROC) analysis (in essence, a diagnostic meta-analysis) of using PTH to diagnose high-turnover disorders revealed an estimate of the sensitivity 93% (95% CI, 87% to 97%) and a specificity of 77% (95% CI, 62% to 87%), using threshold PTH levels between 150 and 200 pg/mL. Thus, PTH is a useful test in detecting high-turnover bone disorders (Fig 7). Studies performed using PTH to diagnose low-turnover bone disorders use levels of 60 pg/mL as the threshold. In this case, the estimated sensitivity and specificity from the ROC analysis were 70% and 87%, respectively. Thus, PTH is also useful in diagnosing low bone turnover (Fig 8). Newer assays specific for 1-84 PTH have recently become available and will likely refine and update this information. In the diagnosis and management of osteodystrophy of CKD, the usefulness of these newer assays for parathyroid hormone are being examined. The normal range for the new assay for 1-84 PTH is 7 to 36 pg/mL (0.77 to 3.96 pmol/L) compared to 16 to 65 pg/mL (1.76 to 7.15 pmol/L) for intact PTH. Thus, the relationship between the 2 assays is about 1:2 (1-84 PTH to intact PTH). The differences in the levels between the 2 types of assays are a reflection of the levels of circulating PTH fragments that are detected by the intact PTH assay but not by the new 1-84 PTH assay.
Current data are insufficient to assess the diagnostic utility of bone markers such as osteocalcin and serum pyridinoline.
Extensive review of the literature revealed numerous gaps in the available database, necessitating that some aspects of this Guideline be based upon opinion. For instance, there were no data indicating the appropriate frequency with which parameters of osteodystrophy of CKD should be followed.
Four studies that provided GFR data showed an inverse relationship between serum PTH levels and GFR (Fig 7). The 2 studies that presented creatinine clearance data showed that serum PTH increases as creatinine clearance decreases (Fig 4). It was not possible to find a function that best described the relationship between GFR and PTH or the relationship between serum creatinine or creatinine clearance and PTH. Despite this difficulty, these data still permit one to make clinically relevant decisions about when to begin screening for high serum levels of PTH. Based on these studies, it is the opinion of the Work Group that measurements of serum PTH levels in CKD patients should be initiated when GFR falls below 60 mL/min/1.73 m2 (ie, Stage 3 CKD).
The most robust available data were related to the use of intact PTH levels as a marker of osteodystrophy of CKD. In this instance, there were seven studies that met the defined criteria selected for meta-analysis and derivation of an ROC curve.23,26,32-34 These data demonstrated the usefulness of intact PTH for predicting both high- and low-turnover bone disease (Figs 7 and 8, respectively). The ability of bone imaging methods to substitute for bone biopsy in the diagnosis of osteodystrophy of CKD has only been adequately studied in the case of erosions demonstrated in standard X-rays as a diagnosis of osteitis fibrosa. A meta-analysis of 5 studies met the criteria to perform an ROC curve.23,35-38 The best single-point estimates of the sensitivity and specificity of erosions as a tool to diagnose osteitis fibrosa were 60% sensitivity and 76% specificity. Thus, standard X-rays were not considered an adequate diagnostic tool. There were no adequate studies evaluating the usefulness of quantitative computed tomography (QCT), dual photon absorptiometry, or DEXA in the diagnosis of osteodystrophy in CKD patients. However, a study using DEXA showed that BMD decreases as GFR declines in CKD patients (Fig 6).

Fig 7. Summary ROC derived from 5 individual studies assessing the diagnostic characteristics of iPTH levels for the diagnosis of high-turnover bone disease. Values on the y-axis are the diagnostic sensitivity and values on the x-axis are the diagnostic specificity. The more effective the test is as a diagnostic tool, the closer it falls to the upper left hand corner of the graph. The summary ROC curve and its 95% CI provide a summary estimate of the performance of the test based on the meta-analytically combined results from all 5 studies. The mean threshold (indicated in the graph by a diamond icon) is the best point estimate of the sensitivity and specificity of iPTH levels for the diagnosis of high-turnover bone disease.

Fig 8. Summary ROC derived from 5 individual studies assesing the diagnostic characteristics of iPTH levels for the diagnosis of low-turnover bone disease. Values on the y-axis are the diagnostic sensitivity and values on the x-axis are the diagnostic specificity. The more effective the test is as a diagnostic, the closer it falls to the upper left hand corner of the graph. The summary ROC curve and its 95% CI provides a summary estimate of the performance of the test based on the meta-analytically combined results from all 5 studies. The mean threshold (indicated in the graph by a diamond icon) is the best point estimate of the sensitivity and specificity of iPTH levels for the diagnosis of low-turnover bone disease.
The application of modern techniques for assessing bone turnover from biochemical markers or imaging is severely limited in osteodystrophy of CKD by the effects of CKD on the tests themselves and by the lack of sufficient studies. As a result, accurate diagnosis and management are difficult. The most robust currently available data, using intact PTH, permit a general distinction to be made between high- and low-turnover osteodystrophy, but recent studies suggest the need for more accurate assays of PTH levels.
These Guidelines promote the use of PTH in the diagnosis and management of osteodystrophy in patients with CKD. They indicate the limited usefulness of other biochemical markers related—in large part—to lack of information. They demonstrate that standard X-rays are not useful and that inadequate data exist in the utilization of other imaging techniques.
Much work is needed to relate biochemical markers of bone turnover to osteodystrophy in CKD. The role of new PTH assays must be further defined. The usefulness of DEXA requires demonstration. Optimal clinical practice guidelines await outcome studies on the monitoring of osteodystrophy of CKD, and validating outcome data of the recommendations made in these guidelines.