NKF KDOQI GUIDELINES
KDOQI Clinical Practice Guidelines for Chronic Kidney Disease: Evaluation, Classification, and Stratification
PART 7. STRATIFICATION OF RISK FOR PROGRESSION OF KIDNEY DISEASE AND DEVELOPMENT OF CARDIOVASCULAR DISEASE
GUIDELINE 13. FACTORS ASSOCIATED WITH LOSS OF KIDNEY FUNCTION IN CHRONIC KIDNEY DISEASE
The level of kidney function tends to decline progressively over time in most patients with chronic kidney diseases.
- The rate of GFR decline should be assessed in patients with chronic kidney disease to:
- Predict the interval until the onset of kidney failure;
- Assess the effect of interventions to slow the GFR decline.
- Among patients with chronic kidney disease, the rate of GFR decline should be estimated by:
- Computing the GFR decline from past and ongoing measurements of serum creatinine;
- Ascertaining risk factors for faster versus slower GFR decline, including type (diagnosis) of kidney disease, nonmodifiable and modifiable factors.
- Interventions to slow the progression of kidney disease should be considered in all patients with chronic kidney disease.
- Interventions that have been proven to be effective include:
- Strict glucose control in diabetes;
- Strict blood pressure control;
- Angiotensin-converting enzyme inhibition or angiotensin-2 receptor blockade.
- Interventions that have been studied, but the results are inconclusive, include:
- Dietary protein restriction;
- Lipid-lowering therapy;
- Partial correction of anemia.
- Attempts should be made to prevent and correct acute decline in GFR. Frequent causes of acute decline in GFR include:
- Volume depletion;
- Intravenous radiographic contrast;
- Selected antimicrobial agents (for example, aminoglycosides and amphotericin B);
- Nonsteroidal anti-inflammatory agents, including cyclo-oxygenase type 2 inhibitors;
- Angiotensin-converting enzyme inhibition and angiotensin-2 receptor blockers;
- Cyclosporine and tacrolimus;
- Obstruction of the urinary tract.
- Measurements of serum creatinine for estimation of GFR should be obtained at least yearly in patients with chronic kidney disease, and more often in patients with:
- GFR <60 mL/min/1.73 m2;
- Fast GFR decline in the past (≥ 4 mL/min/1.73 m2 per year);
- Risk factors for faster progression;
- Ongoing treatment to slow progression;
- Exposure to risk factors for acute GFR decline.
Background
Kidney function progressively declines in most patients with chronic kidney disease after sufficient damage has occurred to lower the glomerular filtration rate (GFR).480 This progressive decline has been attributed to a variety of mechanisms, including failure to resolve the initial injury and onset of self-perpetuating injury, ultimately leading to the typical pathologic features of the “end-stage” kidney and kidney failure. Although the factors responsible for progression of kidney disease are not known in each case, a variety of factors have been associated with more rapid progression and some therapies have been proven to slow the progression of disease.
The intent of this guideline is to examine the literature to determine factors associated with more rapid loss of kidney function in chronic kidney disease. Evidence primarily from longitudinal studies was used to formulate this guideline. Although some authors have performed a meta-analysis of studies, a quantitative data synthesis was not performed for this Guideline.
Rationale
Definitions of Outcome Measures
Progression of kidney disease is defined as either (1) decline in the level of kidney function, estimated by measuring GFR, creatinine clearance or serum creatinine, in a patient who has been followed longitudinally with reliable (and comparable) assays of kidney function, or (2) onset of kidney failure, defined by initiation of kidney replacement therapy, either for symptoms or complications of decreased kidney function. Kidney replacement therapy includes hemodialysis, peritoneal dialysis or kidney transplantation. For consideration of therapy for diabetic kidney disease, development and worsening of proteinuria was also included in the definition of progression of kidney disease.
Strength of Evidence
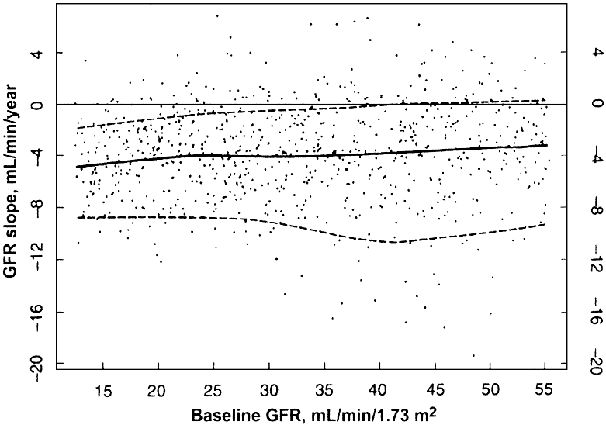
The natural history of most chronic kidney diseases is that GFR declines progressively over time (Fig 47) (R).
Figure 47 |
GFR slopes in the Modification of Diet in Renal Disease Study. The best linear unbiased estimates of GFR slope over 3 years in Study A or overall slope in Study B are shown as a function of baseline GFR. The lower, middle and upper lines represent the 10th, 50th (median), and 90th percentiles of the distribution of GFR slopes, respectively. The GFR slope estimates are not related to baseline GFR, but the variability in slope estimates is higher at higher levels of baseline GFR. Reprinted with permission.480 |
|
Data from the MDRD Study during an average 2-year follow-up show that the average rate of decline in GFR was approximately 4 mL/min/year and was not related to the baseline level of GFR. Approximately 85% of patients had GFR decline during follow-up. The remaining patients experienced improvement or stabilization of GFR.480
Other studies have shown that certain types of kidney disease may undergo complete remission in a substantial number of patients. For example, up to 35% of patients with idiopathic membranous nephropathy481 and up to 30% of patients with primary focal segmental glomerulosclerosis482 may undergo remission of disease.
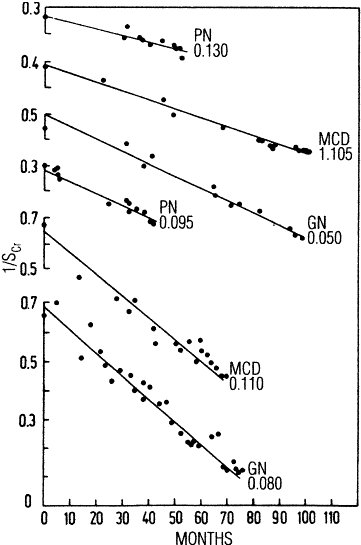
The rate of GFR decline is often relatively constant over time in an individual patient; however, the rate of GFR decline is highly variable among patients, ranging from slowly progressive over decades, to rapidly progressive over months (Table 109 and Fig 48) (R, C).
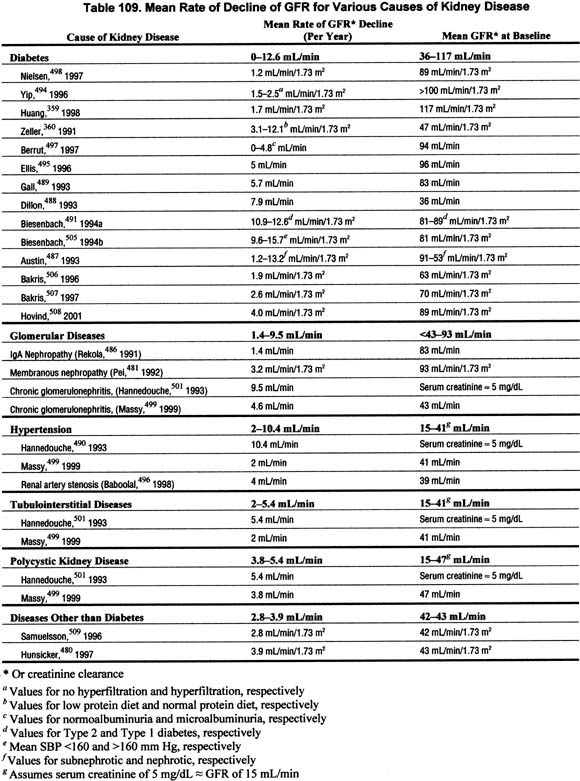
Figure 48 |
Composite plot of reciprocal serum creatinine versus time in six patients with chronic kidney disease. Units of reciprocal serum creatinine concentration are dL/mg. Vertical axis has uniform divisions of 0.1 dL/mg. Final value for each patient is shown. Abbreviations: PN, pyelonephritis; MCD, medullary cystic disease; GN, glomerulonephritis. Reprinted with permission.485 |
|
Many studies have demonstrated that the rate of decline in the reciprocal of serum creatinine concentration (1/SCr) appears constant over time.483,484 One of the earliest such studies is shown in Fig 48. Because of the reciprocal relationship between serum creatinine and GFR, it has been assumed that the constant rate of decline in 1/SCr would reflect a constant decline in GFR. Indeed, studies have shown that the GFR decline does appear relatively constant over time, although other studies have shown that other continuous relationships (such as the logarithm) or non-continuous (spline) relationships may fit the data better in some cases.
The studies reviewed for this guideline show a wide range in the rate of GFR decline among studies, as well as among individual patients (Table 109). The mean rate of decline in GFR varied widely, from no decline to over 12 mL/min/1.73 m2 per year.359,481,486-500 The standard deviations of GFR declines, expressed as a percent of the mean GFR decline, also vary widely, from approximately 25% to 150%.
The rate of decline in GFR can be used to estimate the interval until the onset of kidney failure (Table 110) (R).
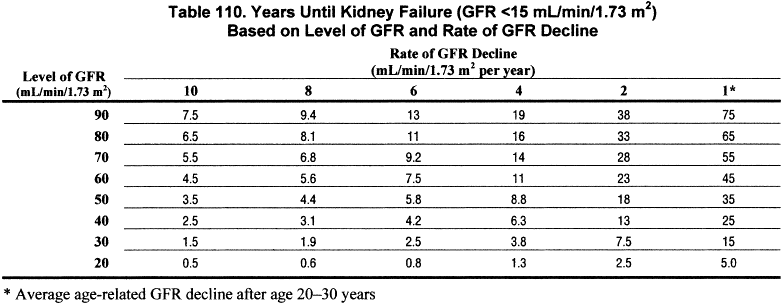
In principle, if the rate of GFR decline is constant over time, then the interval until the onset of kidney failure could be estimated from the current level of GFR and the rate of decline in GFR. An estimate of the time until kidney failure would be useful to facilitate planning for kidney replacement therapy, or may even suggest that concerns about kidney failure may be unwarranted if life expectancy is short. Table 110 shows the number of years until GFR declines to 15 mL/min/1.73 m2, calculated from the current level of GFR and the estimated rate of decline of GFR. For patients with GFR <60 mL/min/1.73 m2, the interval until kidney failure is approximately 10 years or less if the rate of decline is ≥ 4 mL/min/1.73 m2 per year. This rate of decline can be considered “fast.”
Although it is difficult to predict the rate of decline in GFR, either of the following two general approaches, or a combination of the two, is recommended:
Approach 1: Compute the GFR decline from past and ongoing measurements of serum creatinine; the GFR decline in the past provides a rough estimate of the expected GFR decline in the future (R). In principle, the GFR decline could be computed simply from the slope of the regression line relating estimated GFR versus time. However, there are a number of limitations to estimation of the slope and extrapolation of the rate of decline to predict the time to development of kidney failure. These limitations are related principally to whether the rate of decline is truly constant and the precision of the estimate of the rate of decline.
First, most of the studies that demonstrated a constant rate of decline in kidney function were retrospective, including only patients who had already progressed to kidney failure. The fraction of patients with decreased GFR in whom the subsequent decline in kidney function is constant is unknown.
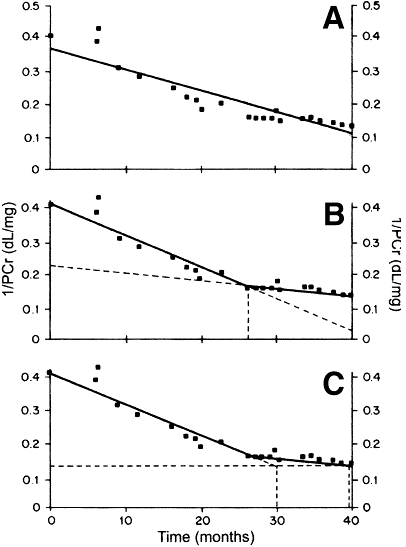
Second, even among patients in whom the rate appears constant, the rate may change over time. In a pooled analysis of four studies of 77 patients with an apparently constant rate of decline in the reciprocal of the serum creatinine concentration, 32% to 51% of patients had a significant change in the slope502 (Fig 49).
Figure 49 |
Plot of reciprocal of plasma creatinine (1/PCr) in a patient. (A) Solid line is single best fit regression line. (B) Solid lines are two best fit regression lines (spline) with an intersection (breakpoint) at 26 months (vertical dashed line). Diagonal dashed lines are extrapolations of the regression lines to earlier and later times. (C) Calculation of prediction error. Solid lines are two best fit regression lines. The diagonal dashed line is an extrapolation of the first regression line to the time when the final value for 1/PCr (0.132 dL/mg) was obtained. The interval predicted from the first regression line was 30 months (left vertical dashed line). The actual interval was 40 months (right vertical dashed line). The prediction error (difference between the actual and predicted intervals) was 10 months (25% of the actual interval). Reprinted with permission.502 |
|
The changes in slope were judged to be spontaneous, since they did not necessarily occur at the time of changes in therapy. In that study, the second slope was less steep in 61% of cases and more steep in 39% of cases. The magnitude of the changes in slope was relatively large in comparison to the first slope (mean of 130% of the value of the first slope). Consequently, the mean error in the interval until reaching the final serum creatinine was also relatively large, 27% of the predicted interval (Fig 49).
Similar changes in slope of GFR decline have sometimes been observed in clinical trials, where they have been attributed to the effect of the interventions (for example, low protein diet, strict blood pressure control, ACE inhibition).
Figure 50 |
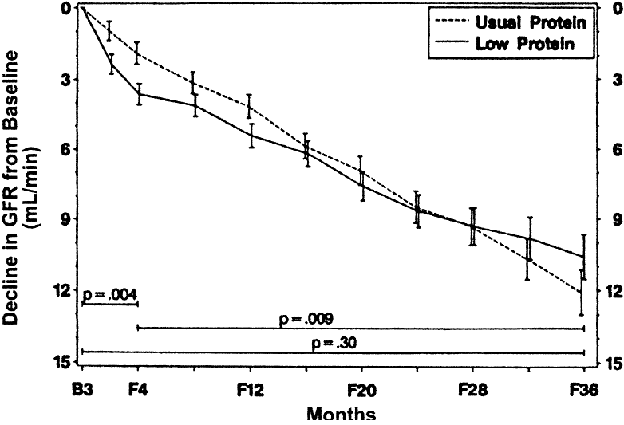
Comparison of GFR decline between diet groups in the Modification of Diet in Renal Disease Study. Estimated mean (ąSEM) GFR decline from baseline (B) to selected follow-up times (F) in Study A are shown. From baseline to 4 months of follow-up, mean GFR decline was 1.6 mL/min faster in the low protein diet group (P = 0.004). From 4 months to the end of follow-up, mean GFR decline was 1.1 mL/min/month (28%) slower in the usual protein diet group (P= 0.009). From baseline to 3 years of follow-up, the projected mean GFR decline was 1.2 mL/min (10%) less in the low protein diet group (P = 0.30). Adapted from Klahr et al315 and reprinted with permission.492 |
|
Figure 50 shows data from MDRD Study A. GFR decline was faster in the first four months after randomization to a low protein diet and a slower decline thereafter compared to patients randomized to a usual protein diet.492 The authors hypothesized that the greater decline soon after the intervention was related to a hypothesized beneficial effect of the intervention: an initial decrease in single nephron GFR, followed by a subsequent slowing in the rate of decline in the number of nephrons.503
Third, even if the rate of decline is constant, the precision of the estimate of the slope depends on a number of variables, including the true rate of decline, the number of measurements of kidney function, measurement error, biological variability, and the duration of follow-up. At least three previous measures of kidney function are necessary (more are better) to permit a precise estimate of the slope, especially if the rate of decline is slow.504
Approach 2: Ascertain factors associated with a “fast” or “slow” GFR decline; these factors include type (diagnosis) of kidney disease, nonmodifiable and modifiable factors (R). For this review, longitudinal studies were compiled to relate the rate of decline in kidney function with the potential associated factors. Observational studies and interventional trials were included. The effect of interventions on the rate of progression is summarized in a later section. The articles reviewed were published between 1984 and 2000. The studies varied in the levels of kidney function assessed, sample sizes, and methodological quality. Duration of follow-up is a key component of studies of prognosis. Duration of follow-up between 1 and 3 years or less than 1 year is noted in the tables.
The rate of GFR decline is related to the type of kidney disease; diabetic kidney disease, glomerular diseases, polycystic kidney disease, and kidney disease in transplant recipients are associated with a faster GFR decline than hypertensive kidney disease and tubulointerstitial kidney diseases (Tables 109 and 111) (C, R).
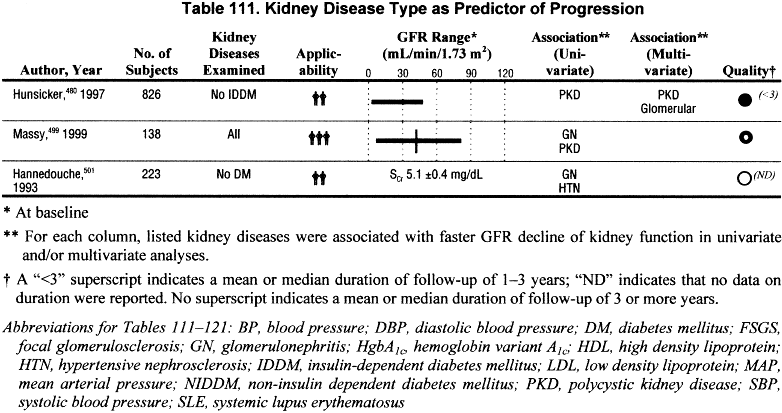
Few studies specifically related rate of GFR decline to type of kidney disease (Table 111). The MDRD Study was the largest, with a sample size of 826, while the other two studies had between 138 and 223 subjects. These studies reported somewhat conflicting results. In the MDRD Study480 and the study by Massy,499 polycystic kidney disease was associated with a faster rate of progression, whereas in the study by Hannedouche,490 polycystic kidney disease was associated with a slower rate of progression. Massy and Hannedouche both reported that glomerular disease was associated with a faster rate of progression than tubulointerstitial nephropathy. However, these two studies showed a conflicting result regarding the rate of progression associated with hypertensive kidney disease. These studies either excluded diabetics, or had a very small proportion of patients with diabetes in the study sample.
Additional information regarding different rates of GFR decline depending on underlying cause of kidney disease was extracted from studies of isolated causes of kidney disease or from studies which provided rates of progression for individual causes of kidney disease. Table 111 shows the reported or estimated rates of GFR decline that were described for different causes of kidney disease.
The data presented in Table 111 are not easily compared; the study methods varied (retrospective or prospective, observational, or interventional), different measures of kidney function were used, and the effect of interventions or other potential confounders cannot be determined. Nonetheless, the crude data suggest a trend for more rapid progression among patients with diabetes, especially those patients with proteinuria or decreased GFR, compared with other causes of kidney disease. There was a wide range of rates of decline among patients with nondiabetic kidney disease. Data on rates of GFR decline among kidney transplant recipients could not be found. However, the Work Group concluded that GFR decline is faster than in many other causes of chronic kidney disease given that graft survival rates are approximately 75% at 5 years for living donors and 60% at 5 years for cadaveric donors509 or an approximate half-life until graft failure for kidney transplants of approximately 12 and 7, respectively. Loss of kidney function for transplant recipients is influenced by episodes of rejection, use of immunosuppressive agents, patient gender and size, and quality of the donor kidney, among other factors.
The rate of GFR decline is related to some nonmodifiable patient characteristics, irrespective of the type of kidney disease; African-American race, lower baseline level of kidney function, male gender, and older age are associated with a faster GFR decline (C).
Race (Table 112).
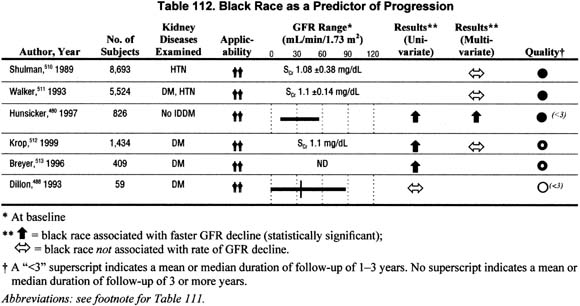
Six studies addressed the association of race with the rate of GFR decline in either univariate or multivariate analyses. Half reported a faster rate of progression among blacks; however, only one study reported a significant association between black race and faster rates of progression in multivariate analysis.
Level of Kidney Function (Table 113).
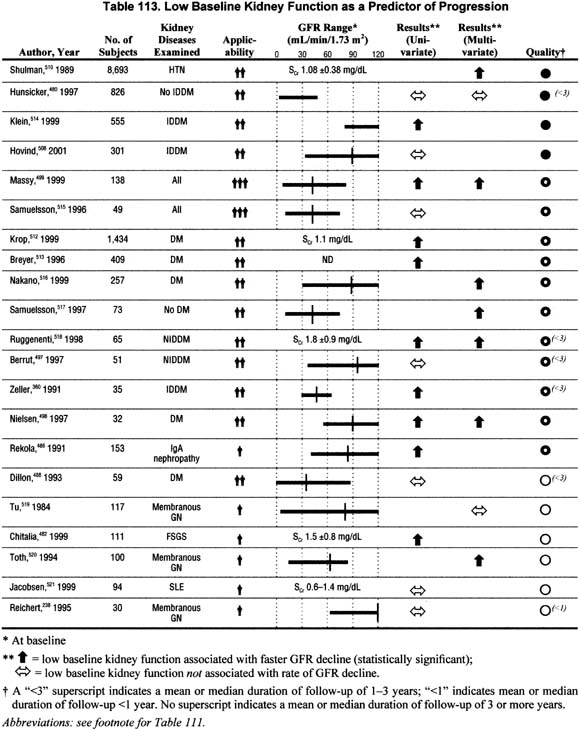
Twenty-one studies addressed the association of low baseline level of kidney function with the rate of GFR decline in either univariate or multivariate analyses. The majority of the studies reported a faster rate of progression among individuals with lower baseline kidney function, but about one third reported no association. No studies reported a slower rate of progression.
Gender (Table 114).
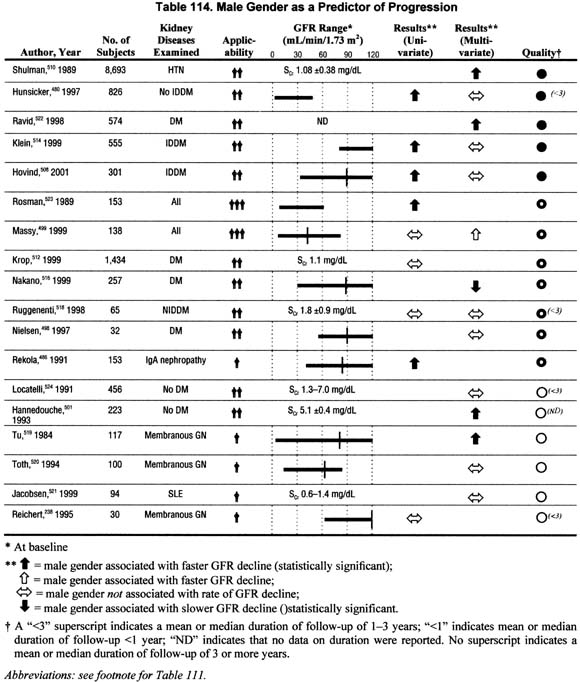
Eighteen studies addressed the impact of gender on the rate of GFR decline in either univariate or multivariate analyses. The data report either a faster rate of progression or no association with male gender, and a single study reported a faster rate of progression among females. The evidence is not conclusive, but suggests a faster rate of progression among men.
Age (Table 115).
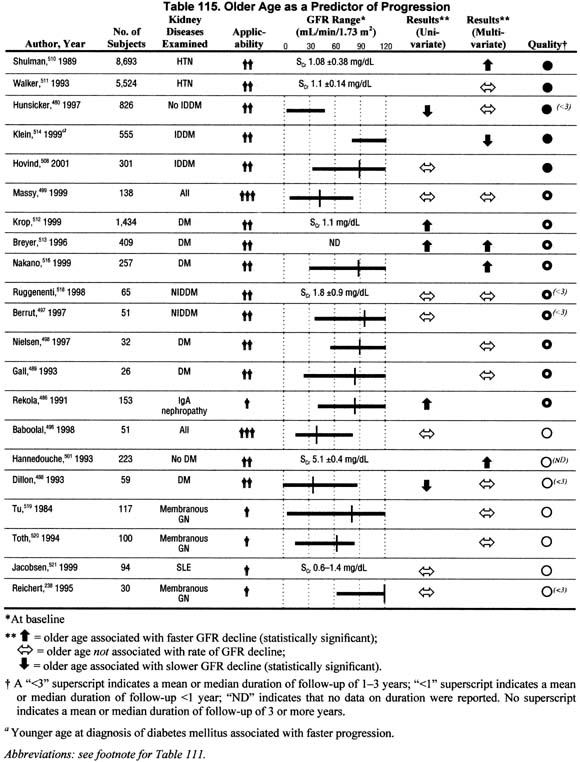
Twenty-one studies reported the association of age with the rate of GFR decline in either univariate or multivariate analyses. These data generally support either an association of older age with faster rates of GFR decline or no association, except among diabetics, where younger age at diagnosis of diabetes is associated with a faster rate of GFR decline. Coupled with the fact that the elderly start from a lower baseline GFR, older individuals with chronic kidney disease deserve special attention and closer follow-up.
The rate of GFR decline is also related to modifiable patient characteristics, irrespective of the type of kidney disease. Higher level of proteinuria, lower serum albumin concentration, higher blood pressure level, poor glycemic control, and smoking are associated with a faster GFR decline. The associations of dyslipidemia and anemia with faster GFR decline are inconclusive (C).
Proteinuria (Table 116).
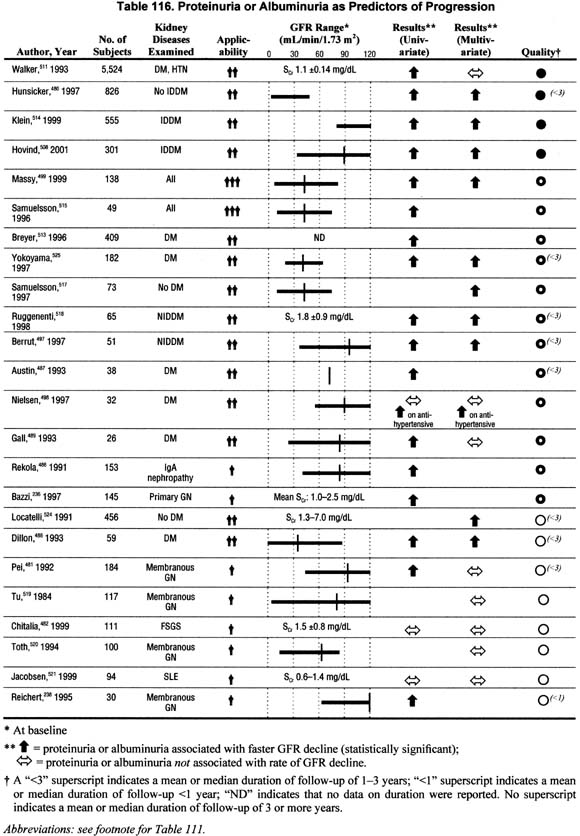
Twenty-four studies addressed the association of proteinuria with the rate of GFR decline in univariate and/or multivariate analyses and showed conflicting results. Although these data do not unanimously show that proteinuria is associated with faster rate of GFR decline when controlling for other factors, the studies with larger sample sizes and higher methodological quality and applicability do support the association.
Low Serum Albumin (Table 117).
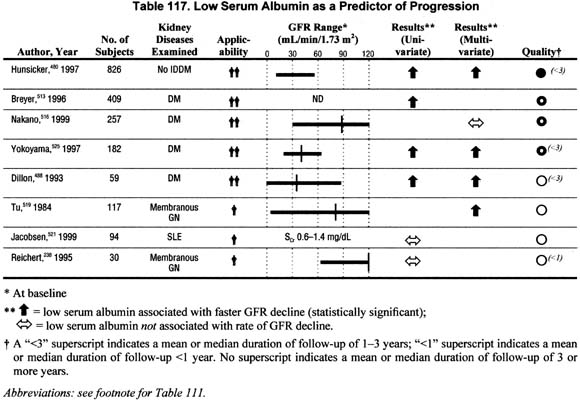
Eight studies addressed the association of low baseline serum albumin with rate of GFR decline in either univariate or multivariate analyses. The association of low serum albumin with faster rate of GFR decline was more consistently noted in studies of diabetic patients. No studies reported a slower rate of GFR decline associated with low serum albumin.
Blood Pressure (Table 118).
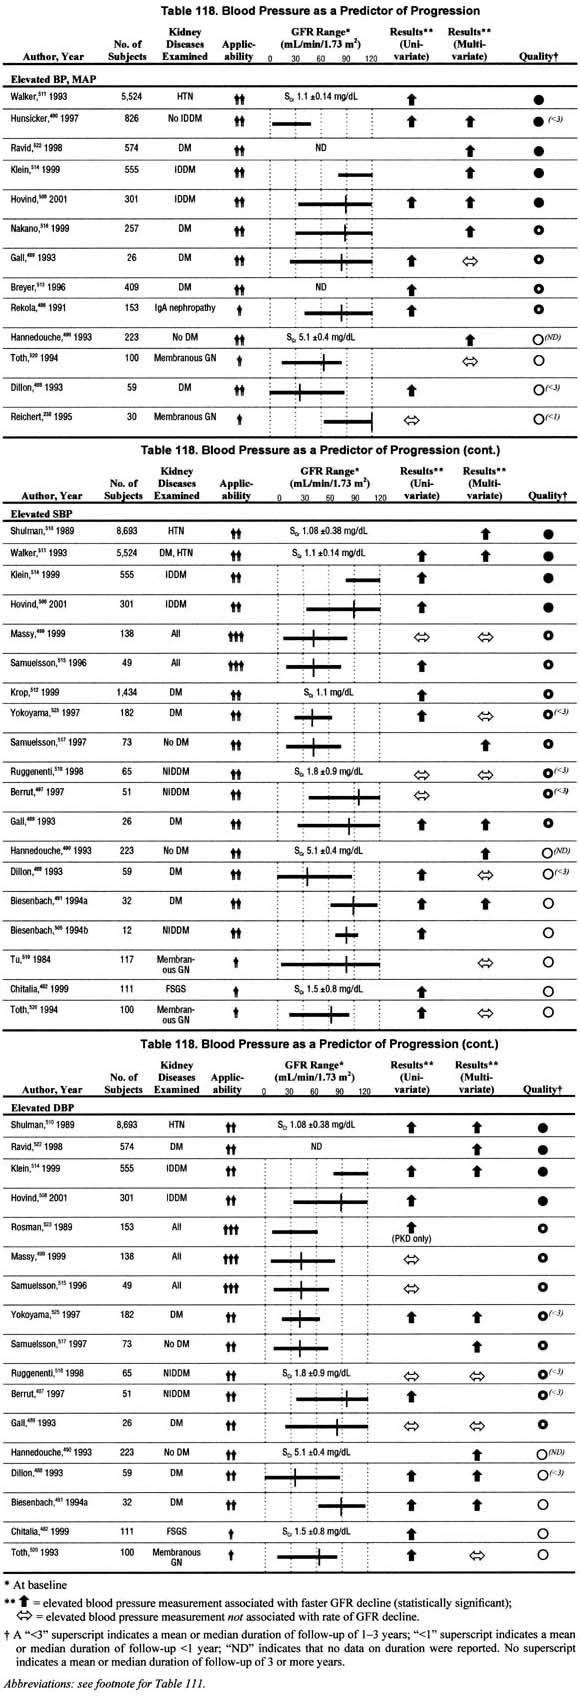
Twenty-six studies related blood pressure levels to the rate of GFR decline in univariate and/or multivariate analyses. The studies differed in that they assessed systolic blood pressure, diastolic blood pressure, or mean arterial pressure—two of these or all of these. Most studies reporting multivariate analyses showed a significant association between elevated blood pressure, based on any measures of blood pressure, and faster rate of GFR decline. There were only 7 studies that reported no significant association between elevated blood pressure measures and faster rate of GFR decline in multivariate analysis. These data, though not unanimous, confirm that elevated blood pressure is associated with faster rate of GFR decline when controlling for other factors.
Glycemic Control in Diabetes (Table 119).
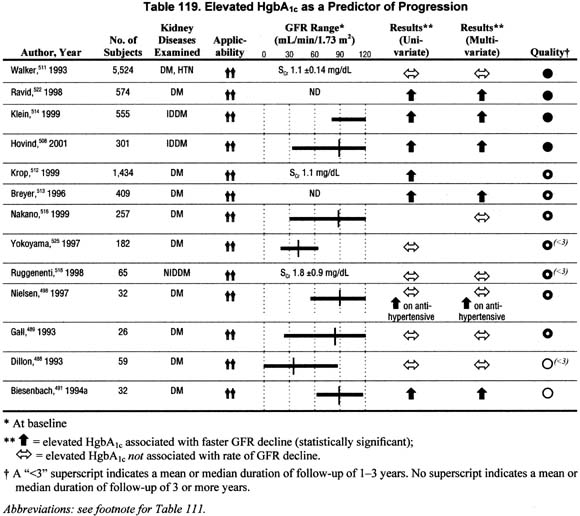
Thirteen studies addressed the impact of poor glycemic control on the rate of GFR decline in univariate and/or multivariate analyses. There were 6 studies that reported in multivariate analyses a significant association between poor gly cemic control, either an elevated fasting blood sugar and/or HgbA1c levels and faster rate of GFR decline; in one of these the association was noted only among patients on antihypertensive agents. A similar number of studies showed no significant association between poor glycemic control and faster rate of GFR decline in multivariate analyses. Although these data do not unanimously show that poor glycemic control is associated with faster rate of GFR decline when controlling for other factors, the studies with larger sample sizes and higher methodological quality and applicability do support the association.
Smoking (Table 120).
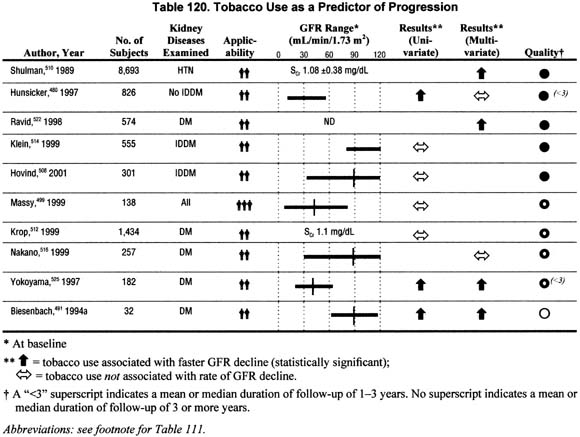
Ten studies reported the association of smoking on the rate of GFR decline in univariate and/or multivariate analyses. The reviewed studies reported conflicting results. However, the large sample sizes and adequate methodological quality and applicability of the studies supporting the association of smoking with faster rate of GFR decline provide reasonable evidence that there may be a deleterious effect of smoking on rate of progression.
Dyslipidemia (Table 121).
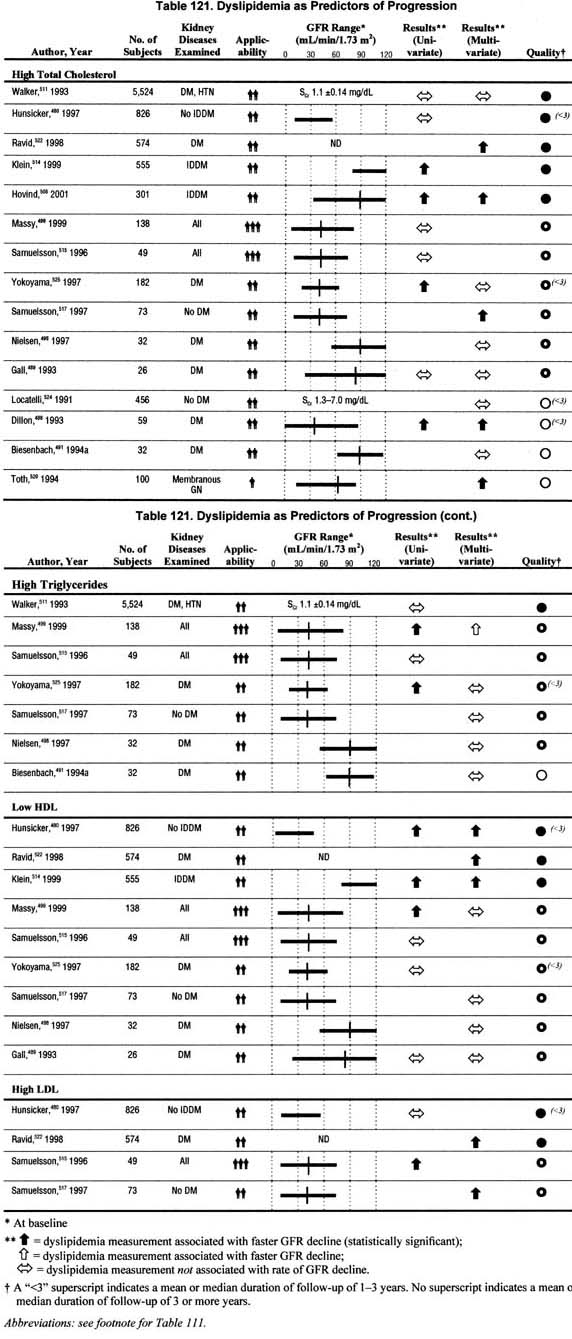
Fifteen studies addressed the association of dyslipidemia with the rate of GFR decline in univariate and/or multivariate analyses. The studies evaluated one or more of the following factors: high levels of total cholesterol, triglycerides, or low density lipoprotein, and low levels of high density lipoprotein. The impact of dyslipidemia reported herein is based on whether any one of these factors was associated with a faster rate of progression. There were 7 studies that reported in multivariate analyses a significant association between dyslipidemia and faster rate of progression. There were 7 studies that reported no significant association between dyslipidemia and faster rate of progression in multivariate analyses. The data are not sufficient to conclude that dyslipidemia is associated with a faster rate of progression.
Anemia (Table 122).

Seven studies were found that related the rate of GFR decline to anemia or hematocrit/hemoglobin level. However, most of these studies compared rates of progression before or after treatment with erythropoietin and/or iron, or treated versus untreated, and all performed only univariate analyses. There was only one study305 that also compared rate of GFR decline between untreated anemic (hematocrit <30%) and non-anemic patients (hematocrit >30%) with chronic kidney disease. In keeping with the rest of this section the guideline, only this one study was considered for inclusion in an evidence table (Table 122). Of the seven studies, three, including Kuriyama, reported an increased rate of progression among patients with lower hematocrit levels; the remaining studies reported no association. The data are not sufficient to conclude that anemia is associated with a faster rate of progression. Partial correction of anemia is discussed in a later section.
Interventions may slow rate of GFR decline in chronic kidney disease in some circumstances (R). It was beyond the scope of this Work Group to perform a systematic review of the literature on interventions to lower the rate of GFR decline. Thus, the goal of this section was to review published guidelines and position statements by reputable national organizations addressing widely accepted interventions. In addition, meta-analyses of randomized trials or data from selected large randomized trials were used to formulate this guideline. Details of the sources of information are presented in each of the following sections.
Strict glycemic control in diabetes slows the development and progression of chronic kidney disease (R). The American Diabetes Association (ADA) has set forth a Position Statement with guidelines for the care of patients with diabetes mellitus (DM),526 with specific attention to the complication of kidney disease,527 based on the results of the Diabetes Control and Complications Trial (DCCT)528 and extensive review of other published research. Given the rigorous review of the numerous studies by the ADA, its most recently updated Position Statement/Clinical Practice Recommendations (2001) were reviewed for this section.
The goals for intensive glycemic control for the prevention of complications of diabetes, including nephropathy, as presented in the ADA guidelines, are summarized below.
Among patients with insulin dependent diabetes mellitus (IDDM), 80% who have sustained microalbuminuria develop overt nephropathy in 10 to 15 years, and among these, kidney failure develops in 50%. The DCCT, a prospective study comparing conventional with intensive treatment of 1,441 patients with IDDM followed for a mean of 6.5 years, firmly established the benefit of intensive glycemic control in reducing the occurrence of subclinical and overt nephropathy among patients with IDDM.528 This trial demonstrated that the occurrence of nephropathy or its progression is reduced by 40% to 60%, depending on whether the outcome was microalbuminuria (40%), albuminuria (54%), or overt nephropathy (60%). The difference was observed with a mean HgbA1c of 7.2% in the intensively treated versus 9% in the conventionally treated patients.
The role of strict glycemic control in slowing the progression of diabetic kidney disease is less certain. A subgroup of patients within the DCCT with microalbuminuria at baseline (n = 73) showed a trend toward a beneficial effect.528 Another study of 70 patients did not reveal a benefit.529 Both of these studies may have been too small to detect a beneficial effect.
Among patients with non-insulin dependent DM (NIDDM), 20% to 40% of patients with microalbuminuria develop overt nephropathy, and among these, kidney failure develops in 20%. Three randomized trials of strict glycemic control in type 2 diabetes also demonstrate a beneficial effect of strict glycemic control on the development and progression of diabetic kidney disease.
The United Kingdom Prospective Diabetes Study (UKPDS 33) compared strict glycemic control to standard therapy in diagnosed patients with type 2 diabetes.530 The study employed a complex factorial design including diet, sulfonylureas, metformin, and insulin to achieve target fasting blood glucose values of <110 versus <270 mg/dL. Fasting blood glucose values rose over time in both groups; the mean HgbA1c was 11% lower in the intervention group. The intervention group had a 25% reduction in “microvascular” events, a combined endpoint that included both retinal and kidney disease. The data suggested a lower prevalence of microalbuminuria in the intervention group and a reduced incidence of declining kidney function.
The Kumamoto study compared intensive insulin therapy to standard therapy in 110 non-obese patients with type 2 diabetes, using a protocol similar to the DCCT.531 Mean achieved HgbA1c levels were 7.1 versus 9.4% in the intervention and control groups, respectively. The results showed a lower incidence of the development and progression of microalbuminuria.
The Steno Type 2 Study compared an intensive multifactor intervention to standard therapy in 160 patients with type 2 diabetes and microalbuminuria.532 The intervention included not only intensive insulin therapy, but also strict blood pressure control, ACE inhibition, dietary fat restriction, exercise, lipid-lowering drugs, anti-oxidants, and aspirin (in patients with coronary heart disease). There was 73% reduction in the incidence of clinical proteinuria in the intervention group. However, the relative importance of strict glycemic control and any of the other factors cannot be determined from this study.
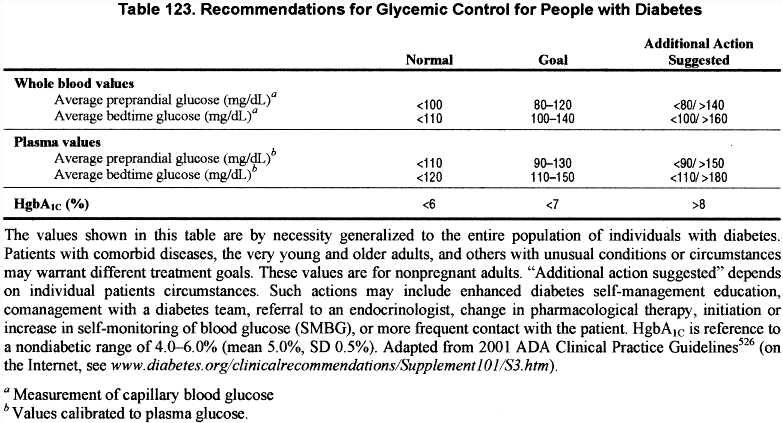
The most recently updated Clinical Practice Recommendations (2001)526 of the ADA regarding intensive glycemic control recommend the following treatment goals for patients with diabetes (Table 123).
“The desired outcome of glycemic control in type 1 diabetes is to lower HgbA1c (or any equivalent measure of chronic glycemia) so as to achieve maximum prevention of complications with due regard for patient safety. To achieve these goals with intensive management, the following may be necessary:
- Frequent self-monitoring of blood glucose (at least three or four times a day);
- Medical nutrition therapy;
- Education in self-management and problem solving;
- Possible hospitalization for initiation of therapy.
“In situations where resource are unavailable or insufficient, referral to a diabetes care team for consultation and/or comanagement is recommended.”
Type 2 diabetes is addressed separately in the ADA guidelines:
“Daily self monitoring of blood glucose is especially important for patients treated with insulin or sulfonylureas to monitor for and prevent asymptomatic hypoglycemia. The optimal frequency of self monitoring of blood glucose for patients with type 2 diabetes is not known, but it should be sufficient to facilitate reaching glucose goals. The role of self-monitoring of blood glucose in stable diet-treated patients with type 2 diabetes is not known.
“Type 2 diabetes treatment methods should emphasize diabetes management as a multiple risk factor approach including medical nutrition therapy, exercise, weight reduction when indicated, and use of oral glucose-lowering agents and/or insulin, with careful attention given to cardiovascular risk factors, including hypertension, smoking, dyslipidemia, and family history. Whether treated with insulin or oral glucose-lowering agents, or a combination, goals remain those outlined in the table.”
Strict blood pressure control slows the progression of chronic kidney disease (R). The Sixth Report of the Joint National Committee on Prevention, Detection, Evaluation and Treatment of High Blood Pressure (JNC-VI),245 the most recently updated ADA Clinical Practice Recommendations (2001),526 the NKF Task Force on Cardiovascular Disease in Chronic Renal Disease,9 and a report from the NKF Hypertension and Diabetes Executive Committees Working Group249 were reviewed for this section. This section will discuss primarily the target blood pressure level for patients with chronic kidney disease, with only brief reference to the role of specific antihypertensive agents. Angiotensin-converting enzyme (ACE) inhibitors and angiotensin-2 receptor blockers are discussed in the next section.
Recommendations for the general population are based on a large body of evidence from observational studies and clinical trials relating blood pressure levels to mortality and cardiovascular disease. There is general agreement that risk stratification should be used in deciding which patients with high blood pressure should be treated and how intensively245 (Table 124).
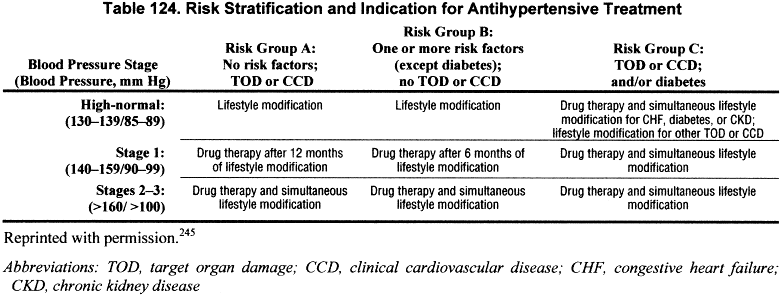
The recommended goal of antihypertensive therapy for patients at low or moderate risk for complications is to maintain systolic and diastolic blood pressure less than 140 and 90 mm Hg, respectively.245 These definitions and goals do not differ according to age (among adults), gender, or race. Target blood pressure is lower in younger patients and related to age, weight and height.533 Patients at greatest risk for complications or who already have evidence of cardiovascular disease are considered for the earliest and more aggressive treatment.
In the general population, the recommended antihypertensive agents are diuretics and beta-adrenergic blockers, because their efficacy in reducing cardiovascular mortality and morbidity has been proven in clinical trials. Recent studies show equal efficacy of angiotensin converting enzyme inhibitors (ACE-inhibitors) and calcium channel blockers in the general population.534,535 In addition, alternative target blood pressure and medications may be preferred in those subgroups of patients with comorbid conditions. These subgroups include, among others, patients with chronic kidney disease, diabetes, and cardiovascular disease.
The knowledge base for chronic kidney disease is substantially smaller. Large-scale epidemiological studies of cardiovascular disease have included few patients with chronic kidney disease, and most clinical trials of antihypertensive agents to prevent cardiovascular disease have excluded patients with decreased kidney function. Some of the important randomized trials on the target level of blood pressure in patients with chronic kidney disease due to diabetes and other diseases are summarized below. The Work Group did not find randomized trials on target blood pressure levels in kidney transplant recipients.
Diabetic kidney disease. The benefit of blood pressure control to levels of approximately 140/90 mm Hg in retarding the decline in GFR in patients with type 1 diabetes was shown years ago.536 The UKPDS has recently shown that better blood pressure control is also associated with decreased development of microalbuminuria in type 2 diabetes.537 There have been no large-scale studies comparing even lower levels of target blood pressure (“strict blood pressure control”) on the progression of diabetic kidney disease. However, a subgroup analysis of the Hypertension Optimal Trial (HOT) showed that patients with diabetes who were randomized to lower levels of blood pressure (diastolic blood pressure of <90 versus <85 versus <80 mm Hg) had lower mortality and fewer cardiovascular disease events than patients with higher blood pressure levels.538 Thus, it seems reasonable to recommend even lower target blood pressure levels for patients with diabetic kidney disease.
Nondiabetic kidney diseases. The MDRD Study is the largest completed randomized trial on strict blood pressure on the rate of GFR decline in nondiabetic kidney disease. A total of 840 patients were randomized either to usual target blood pressure (mean arterial pressure <107 mm Hg, equivalent to blood pressure <140/90 mm Hg) versus a lower-than-usual target blood press (mean arterial pressure <92 mm Hg, equivalent to blood pressure <125/75 mm Hg). The mean separation between randomized groups was 4 to 5 mm Hg. Patients with higher levels of proteinuria at baseline had a greater beneficial effect of the low blood pressure goal. The investigators recommended a lower target blood pressure for patients with urine protein excretion less than approximately 1.0 g/d. At the time of preparation of these guidelines, the African American Study of Kidney Disease and Hypertension (AASK) is nearing completion, and additional information on the benefit of strict blood pressure control in nondiabetic kidney disease is expected in the near future.
Based largely on extrapolation from recommendations for the general population and limited observational studies and clinical trials in patients with chronic kidney disease, the NKF Task Force on Cardiovascular Disease recommended target blood pressure levels and strategies for treatment for patients with chronic kidney disease (Table 125).
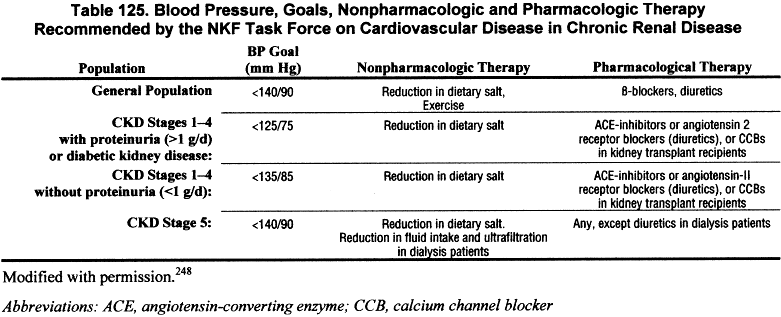
The Task Force recommendations were meant to serve as a guide to clinicians until more definitive recommendations are available.
A KDOQI Work Group has now been established to develop guidelines for the management of high blood pressure in patients with chronic kidney disease not requiring dialysis. The goals of the Work Group are to determine the recommended blood pressure targets, nonpharmacologic therapy, and antihypertensive drug classes for various causes of kidney disease (including diabetes), with additional recommendations for subgroups of patients based on level of kidney function, level of proteinuria, and, if available, age, gender, and race, for prevention of progression of kidney disease, atherosclerotic cardiovascular disease, and heart failure (including LVH).
Angiotensin-converting enzyme inhibitors and angiotensin receptor antagonists slow the progression of chronic kidney disease (R). For this Guideline, the Sixth Report of the Joint National Committee on Prevention, Detection, Evaluation and Treatment of High Blood Pressure (JNC-VI),245 the most recently updated ADA Clinical Practice Recommendations (2001),526 and results of a meta-analysis and selected randomized clinical trials were reviewed. This section presents an overview of the main points of these guidelines and studies. In addition, preliminary results of clinical trials with angiotensin receptor antagonists are briefly discussed. Full detail of the recommendations of the ADA and JNC-VI is beyond the scope of this work, and the reader is referred to these sources for complete guidelines.
In addition to lowering systemic blood pressure, ACE-inhibitors and angiotensin receptor antagonists also lower glomerular capillary blood pressure and protein filtration, which may contribute to their beneficial effect in slowing progression.539,540 They may also have a beneficial effect in reducing angiotensin II mediated cell proliferation and fibrosis.540
Diabetic kidney disease. The ADA recommends the use of ACE-inhibitors for diabetic patients with any evidence of kidney disease (microalbuminuria or greater degree of proteinuria), regardless of the presence of hypertension, in the absence of contraindications or complications:
“Many studies have shown that in hypertensive patients with type 1 diabetes, ACE-inhibitors can reduce the level of albuminuria and can reduce the rate of progression of renal disease to a greater degree than other antihypertensive agents that lower blood pressure by an equal amount. Other studies have shown that there is a benefit in reducing the progression of micro albuminuria in normotensive patients with type 1 diabetes and normotensive and hypertensive patients with type 2 diabetes.
“ACE-inhibitors may exacerbate hyperkalemia in patients with advanced renal insufficiency and/or hyporeninemic hypoaldosteronism. In older patients with bilateral renal artery stenosis and in patients with advanced renal disease even without renal artery stenosis, ACE-inhibitors may cause a rapid decline in renal function. Cough may also occur. This class of agents is contraindicated in pregnancy and therefore should be used with caution in women of childbearing potential.
“Because of the high proportion of patients who progress from microalbuminuria to overt nephropathy and subsequently to ESRD, use of ACE-inhibitors is recommended for all type 1 patients with microalbuminuria (30–299 mg/24hr), even if normotensive. However, because of the more variable rate of progression from microalbuminuria to overt nephropathy and ESRD in patients with type 2 diabetes, the use of ACE-inhibitors in normotensive type 2 diabetic patients is less well substantiated. Should such a patient show progression of albuminuria or develop hypertension, then ACE-inhibitors would clearly be indicated. The effect of ACE-inhibitors appears to be a class effect, so choice of agent may depend of cost and adherence issues.”
Two randomized trials comparing the impact of angiotensin receptor blockers with conventional antihypertensive treatment on the progression of diabetic kidney disease have recently been completed: Irbesartan in Diabetic Nephropathy (IDNT)541 and Reduction of Endpoints in Non-Insulin Dependent Diabetes Mellitus with the Angiotensin II Antagonist Losartan (RENAAL).542 Both studies showed a beneficial effect of the angiotensin-receptor antagonists. Comparison with ACE-inhibitors is not available to date.
It is important to note that ACE-inhibitors have been found to have beneficial effects on total mortality and cardiovascular disease in diabetic patients without chronic kidney disease.543-545 Although most patients in these studies were hypertensive, the beneficial effect of ACE-inhibitor therapy appeared to be independent of its blood pressure lowering effect. Thus, patients with diabetes and hypertension or chronic kidney disease benefit from ACE-inhibitors. If blood pressure remains elevated after initiation of an ACE-inhibitor, other antihypertensive agents should be prescribed to achieve target blood pressure.
Nondiabetic kidney disease. The JNC-VI recommends ACE inhibitors as the drug of choice for treating hypertension among some types of patients with nondiabetic kidney disease:
“The most important action to slow progressive renal disease is to lower blood pressure to goal. All classes of antihypertensive drugs are effective, and, in most cases, multiple antihypertensive drugs may be needed. Impressive results have been achieved with ACE-inhibitors. . . in patients with proteinuria greater than 1 gram per 24 hours, and in patients with renal insufficiency. Consequently, patients with hypertension who have renal insufficiency should receive, unless contraindicated, an ACE-inhibitor (in most cases, along with a diuretic) to control hypertension and to slow progressive renal failure. In patients with creatinine level of 265.2 µmol/L (3 mg/dL) or greater, ACE-inhibitors should be used with caution.
“An initial transient decrease in GFR may occur during the first 3 months of treatment as blood pressure is lowered. If patients are euvo lemic and creatinine rises 88.4 µmol/L (1 mg/dL) above baseline levels, creatinine and potassium should be remeasured after several days; if they remain persistently elevated, consideration should be given to the diagnosis of renal artery stenosis and ACE-inhibitors and angiotensin II receptor blockers discontinued because these drugs can markedly reduce renal perfusion in patients with bilateral renal artery stenosis or renal artery stenosis to a solitary kidney.”
These recommendations are based on a number of randomized trials published over the past decade, which have been summarized recently in a meta-analysis of patient level data.546 In that analysis, data on 1860 nondiabetic patients included in 11 randomized clinical trials of various ACE-inhibitors were pooled. The results showed better blood pressure control, lower urine protein excretion and an approximately 30% reduction in the risk of development of kidney failure and the combined endpoint of doubling of baseline serum creatinine or kidney failure in the ACE-inhibitor group. The beneficial effects of ACE-inhibitors to slow progression appeared to be independent of their effects on blood pressure and proteinuria. The results also showed an incrementally greater beneficial effect with greater degrees of proteinuria >0.5 g/d. The benefit to patients with proteinuria <0.5 g/d was inconclusive. A recent report from the African American Study of Kidney Disease and Hypertension (AASK) documents a beneficial effect of the ACE-inhibitor ramipril compared to the dihydropyridine calcium channel blocker amlodipine on the GFR decline in African Americans with nephrosclerosis and decreased GFR.547 The beneficial effect was more pronounced in patients with proteinuria ≥ 300 mg/24 hr.
The available evidence suggests a benefit to using ACE-inhibitors to treat hypertension among proteinuric patients with nondiabetic kidney disease. The benefit may extend to patients without proteinuria but this is not established. The use of ACE-inhibitors must always be done with the consideration that it may have a detrimental effect on GFR in patients with renovascular disease or renal artery stenosis. Furthermore, in kidney transplant recipients, ACE-inhibitors may exacerbate hyperkalemia caused by cyclosporine or tacrolimus. Thus, treatment of patients with chronic kidney disease with ACE-inhibitors requires knowledge of the expected benefits and risks of therapy and careful attention to blood pressure, kidney function, serum electrolytes, and possible drug interactions.
The HOPE Study also demonstrated a beneficial effect of the ACE-inhibitor ramipril on total mortality and cardiovascular disease in nondiabetic patients without chronic kidney disease, but with a history of cardiovascular disease and one cardiovascular disease risk factor (including hypertension).545 The beneficial effect of the ACE-inhibitor appeared to be independent of its blood pressure lowering effect. Thus, non-diabetic patients with chronic kidney disease (especially if they have proteinuria) or cardiovascular disease benefit from ACE-inhibitors. If blood pressure remains elevated after initiation of an ACE-inhibitor, other antihypertensive agents should be prescribed to achieve the target blood pressure.
There is insufficient evidence to recommend for or against routine prescription of dietary protein restriction for the purpose of slowing the progression of chronic kidney disease; individual decision-making is recommended, after discussion of risks and benefits (R). The MDRD Study was designed to determine the impact of protein restriction on rate of GFR decline, however the results of this study were inconclusive.503 Study A compared a low protein diet (0.58 g/kg/d) to a usual protein diet (1.3 g/kg/d) among patients with moderately decreased GFR (25 to 55 mL/min/1.73 m2). As described earlier (Fig 50), there was an initial faster GFR decline in the low-protein diet group, followed by a slower GFR decline thereafter, but no significant benefit over a 3-year interval. Study B compared a very low protein diet (0.28 g/kg/d) supplemented with a mixture of essential ketoacids and amino acids (0.28 g/kg/d) to a low protein diet (0.58 g/kg/d) in patients with severely decreased GFR (13 to 24 mL/min/1.73 m2). There was no apparent benefit of the very low protein diet. There have been several secondary analyses of the data, which provide further information on the effectiveness of these interventions.503 Specifically, comparisons of the distributions of GFR slopes between randomized groups in Study A were consistent with a beneficial effect of the low protein diet group. Analyses of the impact of achieved protein intake in Study B revealed a 49% reduction in risk of kidney failure or death for every 0.2 g/kg lower achieved total protein intake. In another report, it was noted that a specific ketoacid supplement with a very low protein diet may be more beneficial than the supplement with essential amino acids used in the MDRD study.548 A meta-analysis of five randomized trials of 1,413 patients, including MDRD Study A, showed a 30% reduction in kidney failure or death in patients randomized to the low protein diet group.549 A meta-analysis of randomized and uncontrolled trials and observational studies suggested that dietary protein restriction reduced the rate of decline of GFR by only 0.53 mL/min per year.550 Patients in these studies did not reportedly develop hypoalbuminemia or other signs of malnutrition. However, they received intensive nutritional monitoring and counseling. It is thus unclear whether such severely restricted protein diets can be safely prescribed or even maintained in the absence of frequent dietitian involvement.
The Work Group concluded that there was insufficient information to recommend for or against a low protein diet (0.6 g/kg/d) for patients with chronic kidney disease. The lack of firm evidence regarding its impact, and the logistic and financial difficulties of providing intensive nutritional intervention, preclude recommendation of a low protein diet in all patients with chronic kidney disease. Individual decision-making is recommended, after discussion of risks and benefits. This is in agreement with the KDOQI Clinical Practice Guidelines on Nutrition in Chronic Renal Failure,75 which recommends consideration of a low protein diet (0.6 g/kg/d) for patients with GFR in the range of CKD Stage 4 and 5. Whether or not the decision is made to pursue a low protein diet, the Work Group reinforces the importance of maintaining a good nutritional status with advancing chronic kidney disease, which generally would involve evaluation and monitoring by a dietitian, and refers the reader to Guideline 9.
There is insufficient evidence to recommend lipid-lowering therapy for the purpose of slowing the progression of chronic kidney disease (R). Some of observational studies have reported that various dyslipidemias are associated with decreased kidney function in the general population and in patients with chronic kidney disease.480,551-554 However, it is impossible to determine from these studies whether dyslipidemias cause reduced kidney function, result from reduced kidney function, or whether other conditions such as proteinuria cause both reduced kidney function and dyslipidemias. Each of these explanations is plausible, and only randomized, controlled trials can adequately test the hypothesis that dyslipidemias cause a decline in kidney function.
Unfortunately, there are no large, adequately powered, randomized, controlled trials testing the hypothesis that treatment of dyslipidemia preserves kidney function. However, there have been several small studies555-566 and a meta-analysis of these studies.567 This meta-analysis included prospective, controlled trials published before July 1, 1999. Three trials published only in abstract form were included,555,556,566 but one of these studies has subsequently been published in a peer-reviewed journal.566 All patients were followed for at least 3 months, but in only 5 studies were patients followed for at least 1 year. Statins were used in 10 studies, gemfibrozil in 1 study, and probocol in 1 study. Altogether, 362 patients with chronic kidney disease were included in the meta-analysis. The results suggested that the rate of decline in GFR was significantly less in patients treated with a lipid-lowering agent compared to placebo.567 No significant heterogeneity in treatment effect was detected between the studies. However, the quality of the studies was generally low, and their small sample sizes and relatively short duration of follow-up make it difficult to conclude that lipid-lowering therapies reduce the rate of decline in GFR in chronic kidney disease. Clearly, adequately powered, randomized controlled trials are needed to determine the role of lipid-lowering therapy in retarding the rate of decline in kidney function in patients with chronic kidney disease. The evaluation and management of dyslipidemia in patients with chronic kidney disease has been addressed by the NKF Task Force on Cardiovascular Disease in Chronic Renal Disease and is reviewed briefly in Guideline 15. The management of dyslipidemia in patients with kidney failure is the subject of an ongoing KDOQI Work Group.
There is insufficient evidence to recommend for or against partial correction of anemia with recombinant human erythropoietin and or/iron for the purpose of slowing the rate of decline of GFR (R). There have been several studies evaluating the use of erythropoietin and/or iron among patients with chronic kidney disease prior to initiation of dialysis, with the intention of demonstrating effectiveness in improving anemia and lack of harm in terms of increasing the rate of decline of kidney function. Most patients enrolled in these studies had severely reduced kidney function. These studies have shown either no overall difference in the rate of decline of kidney function in treated compared to untreated groups297,304,306 or compared to pre-treatment rates of decline,568 or a slight benefit in terms of a slower rate of decline of GFR in the treated group294,569 and prolongation of time to ESRD569, or reduced proportion of patients who experienced doubling of baseline serum creatinine in the treated versus untreated groups.305 Each of these studies, as well as a study comparing intravenous with oral iron and erythropoietin for the treatment of anemia in chronic kidney disease,570 also concluded that normalization of hemoglobin or hematocrit had essentially no effect on the rate of decline of kidney function. In one study comparing intravenous iron with or without erythropoietin in patients with less severe reduction in kidney function (mean serum creatinine of 2.8 mg/dL), the authors concluded that “treatment of anemia was associated with a slowing of the rate of progression of renal failure” based on the fact that the GFR decline pre-treatment was faster than post-treatment in long term follow-up.571 However, this study excluded patients who progressed to dialysis during the initial study period.
In summary, the reviewed studies were generally designed to demonstrate no difference/no harm of treatment of anemia, primarily among patients with severely reduced kidney function. The available evidence that partial correction of anemia with erythropoietin (and iron) results in improvement in the rate of decline of GFR is therefore inconclusive. Further studies specifically addressing the effects of anemia and its treatment on rate of GFR decline are necessary to clarify this issue. The evaluation and management of anemia should be undertaken as described in Guideline 8, and as previously detailed in the KDOQI Clinical Practice Guidelines on Anemia of Chronic Kidney Disease.265
GFR decline may be irregular. Acute decline in GFR may be superimposed on chronic kidney disease. Risk factors for acute decline in GFR include (R):
- Volume depletion;
- Intravenous radiographic contrast;
- Selected antimicrobial agents (for example, aminoglycosides and amphotericin B);
- Nonsteroidal anti-inflammatory agents (NSAIDs), including cyclo-oxygenase type 2 (COX 2) inhibitors;
- Angiotensin-converting enzyme inhibitors and angiotensin-receptor blockers;
- Cyclosporine and tacrolimus;
- Obstruction of the urinary tract.
Selected review articles were used to formulate this section.572,573
Reduced blood flow to the kidney, toxic insult, obstruction, inflammation, or infection can result in acute deterioration of kidney function. Reduced blood flow to the kidney and intrinsic damage to the kidney because of a nephrotoxic or ischemic insult are the most common causes of acute deterioration of GFR.
Volume depletion accounts for the majority of community acquired cases of acute reduction in the blood flow to the kidney and a resultant reduction in GFR. The most common precipitants of volume depletion are vomiting, diarrhea, poor fluid intake, fever, and diuretic use. Heart failure can effectively result in a reduction of blood flow to the kidney due to reduced cardiac output, in the face of apparent volume overload. The risk of developing acute deterioration of kidney function due to volume depletion is highest in the elderly, as they may already have compromised blood flow to the kidneys due to atherosclerotic disease.
Common toxic insults encountered in clinical practice are radiocontrast dye, aminoglycoside antibiotics, and NSAIDs. In particular, these are likely to result in acute decline in GFR if there is an additional insult such as sepsis, volume depletion, heart failure, or treatment with ACE inhibitors. Toxins can cause kidney failure via a number of mechanisms including (not an exhaustive list): (1) alteration of kidney blood flow (NSAIDs, ACE inhibitors, cyclosporine, radiocontrast agents), (2) direct tubular injury (aminoglycosides, radiocontrast, amphotericin B), (3) intratubular obstruction (acyclovir, sulfonamides), (4) allergic interstitial nephritis (NSAIDs, penicillins, cephalosporins, sulfonamides). The avoidance of potential nephrotoxins, such as intravenous radiographic contrast, certain antibiotics, and NSAIDs must be based on an individualized assessment of the risks of acute decline in GFR versus the therapeutic benefits of treatment. For example, in a patient with debilitating arthritis, avoidance of NSAID use should be considered in light of the benefits of reducing pain and immobility; in a patient with coronary artery disease, the avoidance of intravenous radiocontrast should be weighed against the potential benefits of an angioplasty procedure.
Finally, obstruction can cause an acute decline in GFR if there is bilateral ureteral obstruction, unilateral ureteral obstruction in a person with a single functioning kidney, or obstruction at the level of the bladder. The most common causes of obstruction are prostatic hypertrophy, cancer of the prostate or cervix, or retroperitoneal disorders. In addition, kidney stones, blood, fungal infection, and bladder malignancy may result in obstruction. Unlike with toxic insults, acute decline in GFR due to obstruction is commonly seen in the outpatient setting.
In summary, there are numerous situations that may cause an acute deterioration in the GFR that are potentially avoidable. The clinician should become familiar with the most common causes, in order to prevent avoidable worsening of the course of chronic kidney disease.
Limitations
The formulation of this guideline was limited by a number of factors. Most notably, with many of the studies the results were difficult to compare as they use different measures for kidney function: measured GFR or creatinine clearance, estimation equations for GFR or creatinine clearance, or simply serum creatinine. Further limiting the comparability of the results across the studies is the wide variation in the selection of analytic techniques and presentation of data.
A major limitation of this guideline is its failure to provide a semi-quantitative assessment of the relationships between the factors assessed and the outcomes of rate of progression or risk for kidney failure. This review of these studies does not provide a conclusive answer to the causes underlying the more rapid rate of progression or increased risk for kidney failure.
Clinical Applications
It is important to follow each individual’s rate of progression, as there is a wide variation among individuals and disease types and in the response to interventions.
There is a broad range of factors that are associated with more rapid decline in kidney function, some of which are amenable to interventions.
Certain patient groups, defined by either type of kidney disease, clinical, gender, racial, or age characteristics, are at greater risk for progression of kidney disease—this denotes the need to increase awareness among patients and providers about proper care and the need to institute interventions to attempt to slow progression.
Implementation Issues
Patients with certain causes of kidney disease, and certain modifiable and nonmodifiable characteristics, may be at increased risk for faster rates of GFR decline. There is increasing evidence that certain interventions can slow the decline in GFR and prevent the development of kidney failure in both diabetic and nondiabetic patients.
It is thus critical to educate patients and providers regarding the risk factors and to facilitate providing aggressive interventions where indicated. This may require changing the policies of care providers and payers regarding frequency of follow-up and payment for medications.
Research Recommendations
It is evident that there is a large amount of data in studies of varying size and quality regarding the impact of underlying conditions, patient characteristics, and interventions. However, there are certain factors whose impact has not been conclusively determined, such as dietary protein intake, hyperlipidemia, and anemia and their treatment. Proteinuria as a risk factor deserves special consideration. Antihypertensive agents, especially ACE-inhibitors and angiotensin-receptor blockers, reduce proteinuria and slow the progression of kidney disease. However, the role of proteinuria per se has not been adequately studied. There is a need to develop alternative therapies to reduce urine protein.
Many of the conclusions regarding the impact of factors unrelated to intervention, such as age, gender, race, and cause of kidney disease, come from “small” interventional trials. Similarly, in the case of the impact of blood pressure control, conclusions largely come from the observations that patients with lower blood pressures have improved outcomes. In the case of cause of kidney disease, the conclusion that certain causes are associated with faster rates of progression come from the comparison of studies of single causes, using diverse methods to measure or estimate GFR. A noninterventional prospective cohort study including sufficient numbers of patients with all causes of kidney disease, undergoing similar testing for level of kidney function, would be ideal to evaluate the impact of cause of kidney disease on the rate of decline in GFR. Alternatively, a sufficiently large prospective interventional trial could achieve a similar goal.


