
Quantifying HD is the first step toward assessment of its adequacy. Fortunately, the intermittent rapid decrease in urea concentration during HD allows a relatively easy measurement of the dose.
2.1 The delivered dose of HD should be measured at regular intervals no less than monthly. (A)
2.2 The frequency of treatments should be included in the expression of dose. (A)
2.3 The dose of HD should be expressed as (Kurea × Td)/Vurea (abbreviated as Kt/V), where Kurea is the effective (delivered) dialyzer urea clearance in milliliters per minute integrated over the entire dialysis, Td is the time in minutes measured from beginning to end of dialysis, and Vurea is the patient's volume of urea distribution in milliliters. (B)
2.4 The preferred method for measurement of the delivered dose is formal urea kinetic modeling. Other methods may be used provided they give similar results and do not significantly overestimate the modeled dose. (A)
2.5 Methods described in Appendix can be used to add the continuous component of residual urea clearance to the intermittent dialysis spKt/V to compute an adjusted intermittent Kt/V. Laboratories reporting adjusted session Kt/V values should clearly identify such measurements by a different name (eg, “adjusted” Kt/V or “total” Kt/V). (B)
HD is a process that removes accumulated solute from a patient who has total or near-total loss of kidney function. The process is diffusion of solute from the blood into a physiological salt solution (dialysate) that is separated from the blood by a thin semipermeable membrane, the major component of the dialyzer. The rate of solute diffusion is a vital part of any measurement of dialysis or its adequacy, but the rate of diffusion across the dialyzer membrane is driven by blood concentration and is proportional to it (following first-order kinetics). This linear proportionality for simple diffusion (and convection) allows expression of the dialysis effect as a ratio of the diffusional removal rate (eg, mg/mL) to blood concentration (eg, mg/mL). This ratio, defined as “clearance,” is a fundamental measure of dialysis that tends to remain constant during intermittent treatments as both blood concentrations of small solutes and solute removal rates decrease. Clearance can be measured instantaneously by sampling blood on both sides of the dialyzer or, more appropriately for clinical applications, as an average measurement during the entire duration of a single dialysis treatment by sampling blood at the beginning and end of treatment. This latter approach is simpler and gives a measure of the true delivered dose of HD.
Frequency of Measurements (CPG 2.1)
Numerous outcome studies have shown a correlation between delivered dose of HD and patient mortality and morbidity (see Table 8, Guideline 4).14,53-58 To ensure that patients with CKD treated with HD receive adequate treatments, delivered dose of dialysis must be measured. Clinical signs and symptoms alone are not reliable indicators of dialysis adequacy. In studies of the relationship between delivered doses of HD and patient outcomes, the typical frequency of measurement was monthly.1,54-56,58 Less frequent measurements may compromise the timeliness with which deficiencies in the delivered dose of HD are detected and hence may delay implementation of corrective action. Monthly measurements also are pragmatic because patients undergo blood testing on a monthly basis in nearly all dialysis clinics. Alternatively, the dose can be measured more frequently by using on-line methods (see the discussion of on-line clearance that follows).
Duration and Frequency of HD (CPG 2.2)
Because—as currently applied—therapeutic HD is nearly always delivered intermittently, expression of the dialysis dose as a clearance is advantageous because clearance is relatively constant throughout the treatment despite a marked decrease in blood concentrations of easily dialyzed solutes. To account for variations in the duration and schedule of treatments, dose expression must include factors for both duration and frequency. This contrasts with measurements of continuous kidney function and continuous (peritoneal) dialysis for which a simple clearance rate suffices. To account for the variable time each patient spends on dialysis (treatment time or “t”), the clearance rate can be expressed per dialysis instead of per unit of time. Expression of the dose as a volume processed per dialysis instead of volume flow (volume per unit of time) eliminates the need to measure “t” when calculating the dose (see calculation of clearance next). To account for differences in frequency, either the number of treatments per week must be appended to the expression of dose (eg, 3 treatments per week) or the dose can be expressed as a function of repeating intervals (eg, per week instead of per dialysis). To compare doses among treatments given at different frequencies, the dose for a single treatment typically is multiplied by the number of treatments per week. For example, a target dose of 1.3 urea volumes per dialysis would equate to a target of 3.9 volumes per week for patients treated 3 times per week. Because a more frequent schedule also is more efficient, additional adjustments are required for frequency. The Work Group believed that doses expressed per dialysis should include an element for the number of treatments per week (eg, spKt/V[3] for 3 treatments per week). A more detailed discussion of these effects can be found under “Effects of Dialysis Frequency” in CPR 4, Minimally Adequate Hemodialysis.
Value of Urea as a Marker of Dialyzer Clearance (CPG 2.3)
While the ultimate goal of dialysis treatments is a decrease in solute levels in the patient, measurement of isolated solute levels can be misleading if the solute measured is not representative of all uremic toxins. Because no solute probably qualifies in this respect, it is reasonable to pick as a marker an easily dialyzed solute, such as urea, for which concentrations in the patient decrease significantly during the treatment. Urea clearance determined from a ratio of concentrations, rather than from an absolute value, is a sensitive marker of small-solute diffusion across the dialyzer. Because dialysis most effectively removes small solutes, urea Kt/V is a sensitive measure of the overall dialysis dose.
The Denominator Is the Patient's Water Volume (CPG 2.3)
Native kidney clearance traditionally is adjusted to body size and specifically to body surface area (BSA). This adjustment normalizes the clearance effect among larger and smaller individuals and among species of widely differing size.59,60 However, for intermittent dialysis of solutes that distribute in body water, it is mathematically more convenient to use body water volume as the denominator because by doing so, the clearance expression is reduced from a flow to a fractional removal rate (the rate constant). The product of the rate constant (K/V) and time (t) can be determined easily as a logarithmic function of the predialysis to postdialysis concentration ratio (C0/C): Kt/V = ln(C0/C).61,62 Kt/V is a measure of clearance per dialysis factored for patient size, measured as V. Expressing clearance in this manner eliminates the need to specifically measure the individual components of Kt/V (clearance, time, and body size). Instead, predialysis and postdialysis solute concentrations (C0 and C) provide a measure of average clearance per dialysis factored for the patient's size in this simplified setting with no ultrafiltration or urea generation.
Ultrafiltration and Other Components (CPG 2.4)
However, enhancement of clearance caused by ultrafiltration that almost always occurs simultaneously with diffusional clearance during therapeutic dialysis adds a significant component that must be included along with the simultaneous solute generation rate in the Kt/V calculation. The more complex mathematical expressions that incorporate these vital components require computer programs to precisely calculate Kt/V by iterating the following equation363:
where V is postdialysis urea distribution volume, G is urea generation rate, Kr is residual native kidney urea clearance, B is rate of change in V during dialysis, and Kd is dialyzer urea clearance. Despite the complexities of the equation and the iterative computer model, the expression of clearance simulates solute removal from only a single compartment. Finite diffusion rates among multiple body compartments add complexities that require additional mathematical adjustments, usually requiring numerical analysis for a solution. Fortunately, the errors encountered when applying the simpler model to the usual thrice-weekly dialysis schedule tend to cancel one another, allowing accurate assessment of dose with the single-compartment model.63,64
Simpler Methods (CPG 2.4)
The arguments discussed show that the major determinants of Kt/V are the decrease in urea concentration during dialysis, contraction of body water volume during dialysis, and generation of urea during the treatment. Use of these 3 variables in an empirical formula allows an approximation of Kt/V from a single equation, bypassing the need for formal modeling65:
where R is the ratio of postdialysis BUN to predialysis BUN, t is time on dialysis in hours, and BW is body weight. Although this and other similar methods give an approximation of the true spKt/V, calculated Kt/V matches the computer-derived modeled Kt/V fairly closely when applied to dialysis given 3 times per week for 2.5 to 5 hours. Disadvantages of this equation when used alone to measure Kt/V include no measure of the net protein catabolic rate (PCR) that urea modeling generates and errors when applied to short, frequent, or prolonged dialysis.65 However, additional simplified equations that include the absolute value of predialysis BUN can be used to calculate normalized PCR (nPCR), also called normalized protein nitrogen appearance rate (nPNA).66
Because the relative decrease in urea concentration during therapeutic dialysis is the most significant determinant of Kt/V, direct measurement of URR has been proposed as a simpler substitute for complex equations or formal urea modeling to calculate dialysis dose.
![]()
Although URR correlates well with spKt/V in population studies, significant variability in correlation in individual patients occurs because URR fails to include both the contraction in extracellular volume (ECV) and the urea generation that typically occur during routine HD.
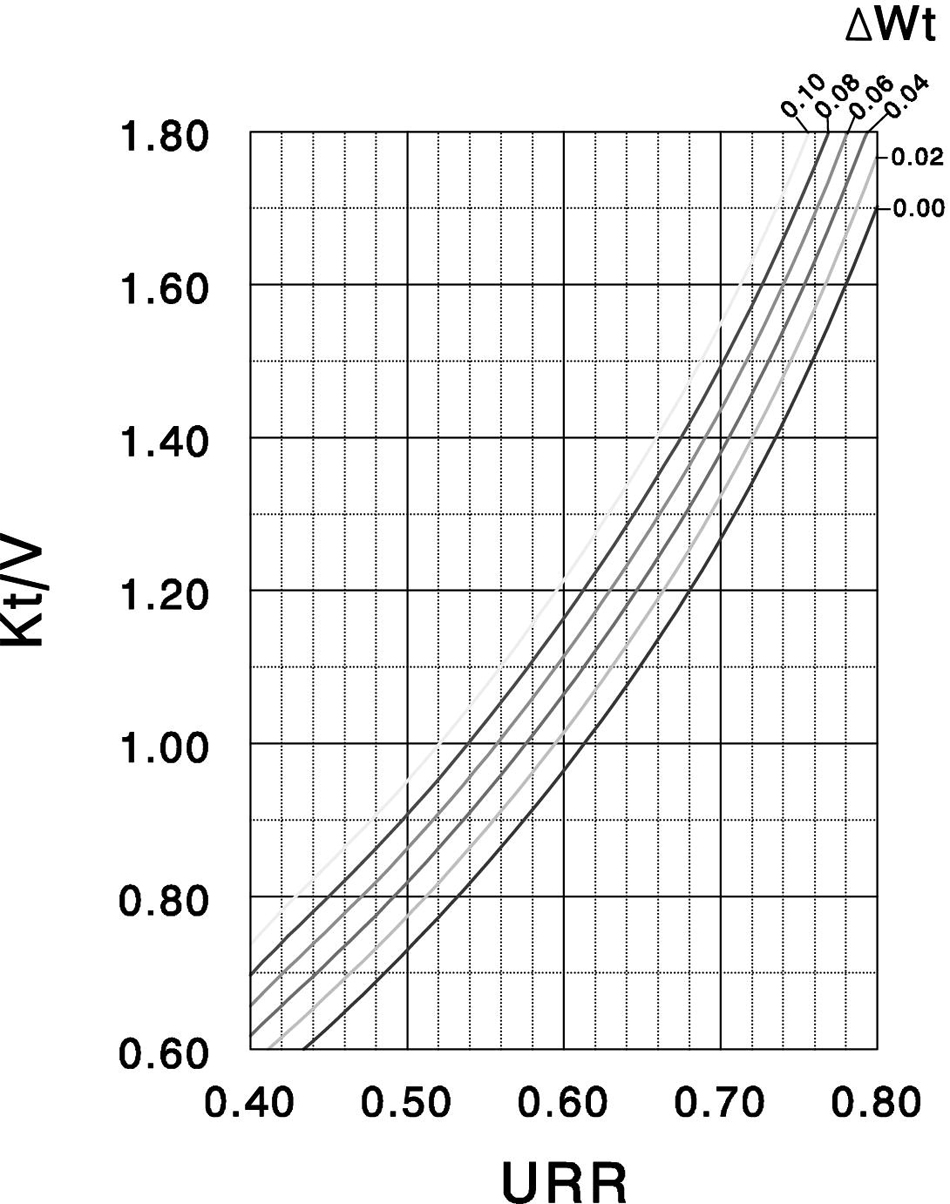
Fig 1. Impact of ultrafiltration on delivered dose of HD measured by using spKt/V and URR. The curves are derived from formal single-pool modeling of urea kinetics assuming a 3-hour dialysis, no RKF, and a volume of urea distribution that is 58% of BW.
![]() Wt refers to net ultrafiltration losses as a fraction of final BW. Reprinted with permission.67
Wt refers to net ultrafiltration losses as a fraction of final BW. Reprinted with permission.67
Fig 1 shows that for a given value of Kt/V, URR may vary considerably depending on the fraction of weight lost during dialysis. However, when outcomes, including death, are correlated with either URR or Kt/V, no difference in degree of correlation is detectable. The reason for this lack of a better correlation with Kt/V probably results from the narrow range of doses achieved during HD and the curvilinear relationship between the 2 parameters. When level of kidney replacement increases, especially when treatment is given daily, URR approaches zero. URR also is zero in continuously dialyzed patients or patients with normal kidney function. Other disadvantages of URR include the inability to adjust the prescription accurately when the value is off target (by adjusting K or t), inability to add the effect of RKF, and inability to troubleshoot by comparing prescribed with delivered dose.
Native Kidney Function (CPG 2.5)
The Canada-USA (CANUSA) Study of PD patients suggested that native kidney function contributed more than dialysis function to improve outcomes at each level of total creatinine or urea clearance.68 In view of the HEMO Study findings that prolonging HD in the current thrice-weekly model does not improve outcome or QOL1, failure to include residual clearance in calculation of the required dose could lead to “excessive” dialysis that would compromise patient QOL. The reduction in quality years may vary from patient to patient, who consider time spent on dialysis of variable quality. These observations strongly support the notion that native kidney function should be included in any expression of overall kidney function (both native and replacement). However, omission will protect the patient from underdialysis when RKF is lost. For further discussion and practice recommendations, see CPR 2, Methods for Measuring and Expressing the HD Dose.
Equilibrated Kt/V (eKt/V)(CPG 2.3)
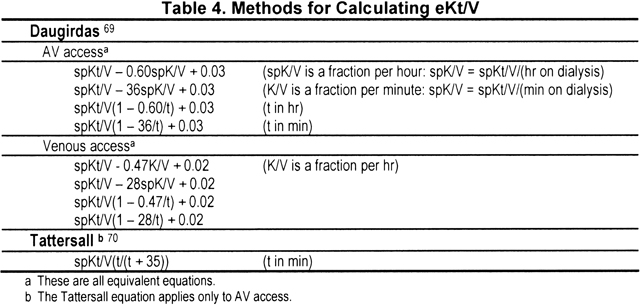
When the time is shortened and dialysis is intensified, the treatment is less efficient because solute disequilibrium is enhanced and more time is available for solutes to accumulate between treatments. Allowance for solute disequilibrium can be made by adjusting spKt/V for the rebound in urea concentration at the end of dialysis. The resulting eKt/V has a time-dependent factor that reflects the intensity of dialysis for a given delivered dose (spKt/V), as shown in Table 4. The first formula by Daugirdas shown in Table 4, often called the “rate equation,” was derived from regression data that showed a tight fit with values measured by using the rebounded BUN measured 30 or 60 minutes after dialysis.69 The Tattersall equation was derived from theoretical considerations of disequilibrium and rebound, but the coefficient was derived from fitting to actual data.70 The Leypoldt equation is a recent addition, also based on empirical fitting of measured data.71
Many, including our European colleagues,12 would like to convert the dose benchmark from spKt/V to eKt/V for HD (for PD, eKt/V and spKt/V are identical). Concern is raised about rapid dialysis in small patients, for whom the difference between spKt/V and eKt/V is larger (Fig 2). After debating this issue in depth, the KDOQI HD Work Group unanimously decided to disallow shortened dialysis for treatments 3 times per week, but to do this explicitly rather than as a modification of Kt/V (see CPG 4). Use of eKt/V as a benchmark does not prohibit ultrashort dialysis provided the clearance can be increased, for example, by increasing blood and dialysate flow rates or increasing dialyzer surface area. For such highly sequestered solutes as phosphate, this would not improve removal and the shortened dialysis time would compromise fluid removal, as noted in CPG 5. For pediatric and small adult patients, the size-associated mortality risk may be related in part to the shortened dialysis time often prescribed for small patients. Previous reports and recent evidence from the DOPPS showing a positive correlation between dialysis treatment time and mortality support the concept that ultrashort dialysis (<3 hours), despite an adequate spKt/V, should be avoided.72,72A Of note, eKt/V determined by using all the formulas in Table 4 first requires measurement of spKt/V, and if the prescribed dose requires adjustment, conversion back to spKt/V is required to determine the change in dialyzer K that is required. Equilibrated K cannot be adjusted directly. In the absence of more evidence that would favor the additional effort and target-range adjustment required to substitute eKt/V for spKt/V, the Work Group elected to stay with the currently established standard.
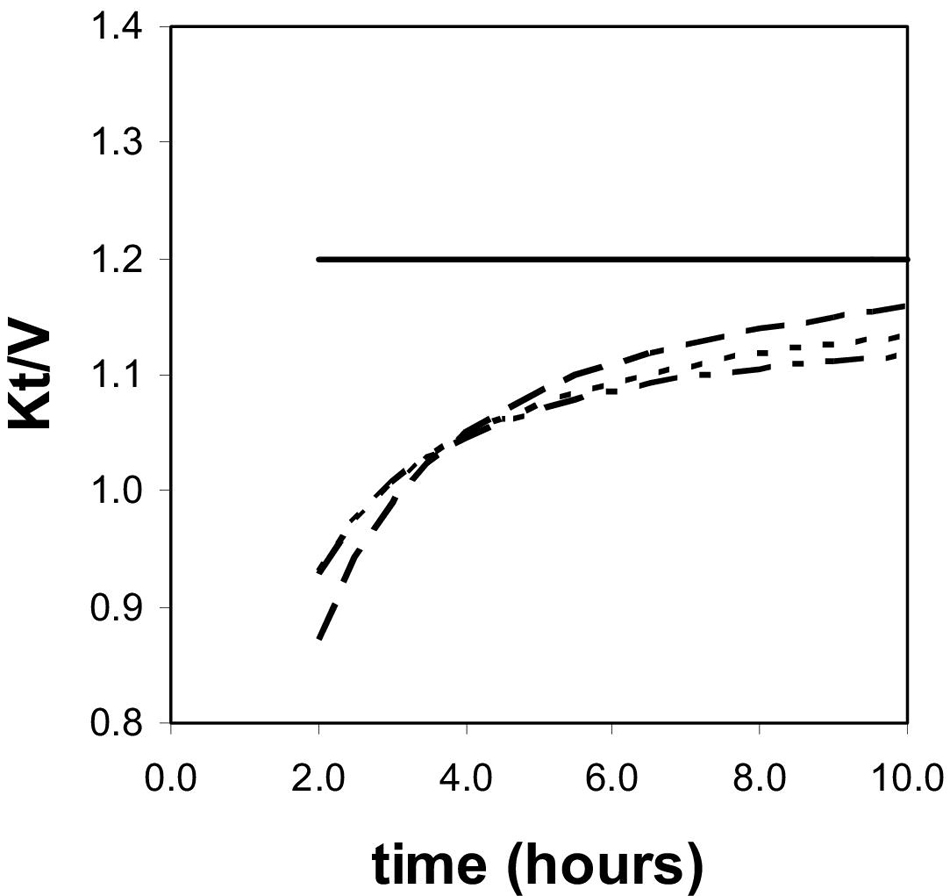
Fig 2. eKt/V as a function of dialysis treatment time. The rate equations for eKt/V (lower 3 lines) predict that dialysis efficiency decreases as time is shortened, creating a larger difference between eKt/V and spKt/V. (— spKt/V, – – Daugirdas,69 ---- Tattersall et al,70– - – Leypoldt et al71 )
On-line Clearance (CPG 2.4)
The requirement for monthly measurements of HD adequacy is a compromise between cost and the utility of the measurement. The dose can be assessed more frequently by measuring conductivity (or ionic) clearance across the dialyzer membrane. This method does not require consumables or blood sampling and can be used with each dialysis treatment to predict the delivered Kt/V in real time before the treatment is finished.73-76 The method is based on the assumption that changes in dialysate conductivity are caused by transmembrane movement of small electrolytes, mostly sodium, that behave like urea. A step up in dialysate sodium concentration followed by a step down while measuring conductivity changes in the effluent dialysate tends to eliminate the effect of cardiopulmonary recirculation (CAPR) and provides a sodium clearance that is similar to or only slightly less than the simultaneously measured cross-dialyzer urea clearance.76 When applied in this fashion, conductivity clearance can be used safely as a substitute for the blood-side urea method for measuring dialysis dose.
To avoid errors from changes in clearance during dialysis, multiple ionic clearance measurements must be performed throughout the treatment. To calculate Kt/V, time on dialysis and V must be determined accurately. The latter is a potential problem if anthropometric formulas are used to estimate V because these formulas are estimates that often differ significantly from the true value. Discrepancies between anthropometric estimates of BSA and apparent need for dialysis have similarly confounded interpretations of creatinine clearance and GFR during CKD stages 1 to 4. Conversely, errors in modeled V do not translate directly to errors in dialysis dose because they are caused most often by errors in estimated K. The dose, which is based on the ratio K/V, which, in turn, is derived mostly from the log ratio of predialysis to postdialysis BUN (see previous discussion), is more accurate and patient specific. In addition, anthropometric formulas for V recently were shown to overestimate V in HD patients on average by approximately 15%.77 However, this systematic overestimation of V tends to protect the patient from underdialysis.
Instead of estimating V, one approach uses modeled V, measured monthly from urea kinetic modeling, as the denominator.76 If conductivity clearance is measured during the modeled dialysis, it can be used in place of the predicted clearance, eliminating the necessity to record blood flow, dialysate flow, and dialyzer urea mass transfer-area coefficient (K0A) to calculate K and V. This approach reduces the variance associated with anthropometric V, as discussed; preserves the value of V as a patient-specific measure of body composition; and allows calculation of the patient's G and nPCR.
Another suggested approach uses BSA instead of V as the denominator (see previous discussion of the denominator and V).78 This measure of dialysis dose is appealing because it tends to equate dialyzer function with native kidney function by using the same denominator, which is closer than V to the universal scaling factor discussed. However, it sacrifices the individual specificity of V and G, relying instead on population averages to calculate BSA from body height and weight.
Although these approaches to measuring the dialysis dose are intriguing and increasingly popular, the HD Work Group believed that compelling evidence for an improvement that would justify changing the current methods for measuring dialysis is lacking. Measurement of the integrated clearance as Kt/V from a simple ratio of predialysis to postdialysis BUN is possible only in patients dialyzed intermittently for whom BUN values fluctuate greatly. These fluctuations provide an opportunity to measure adequacy, V, and nPCR that is unparalleled in other therapeutic settings. The suggested newer methods using on-line clearance and/or a different denominator beg for research that could, in the future, provide evidence for superior performance as a measure of dialysis adequacy (see HD Research Recommendations).
Summary of Methods
Table 4A lists the expressions of dose and methods currently used in clinical practice to measure the delivered dose of dialysis. Preference continues to be given (similar to the previous KDOQI recommendations) to delivered Kt/Vurea as the best outcome correlate and to the method of single-pool urea kinetic modeling because of its simplicity, accuracy, and targeting of small-solute clearance, the principal therapeutic effect of HD. While eKt/V theoretically is more indicative of the true dialysis effect, its major advantage is seen during short treatments; it cannot be adjusted directly and it requires measurement of spKt/V for estimation from the regression-based formulas shown in Table 4. Because CPR 4 now limits shortened dialysis and for lack of standards, as well as evidence, that eKt/V correlates better with outcome, the KDOQI Work Group, in contrast to the European Standards Group,12 did not strongly recommend this expression of dose.

To accurately measure Kt/V from the decrease in BUN levels during dialysis, the decrease must be significant, ie, the 2 concentrations (C0 and C) must be significantly different from one another (ratio > ~1.5). This means that the dialysis schedule must be truly intermittent to avoid excessive mathematical variance. As the frequency and duration increase, measurement of Kt/V becomes less precise.
Measurement of HD dose and adequacy can be anticipated by both the dialysis staff and the patient. Even if unannounced in advance, modeled or measured dialysis may differ from the typical dialysis because staff are alerted by the predialysis BUN sampling. This issue was addressed by a study that found a higher average blood volume processed during the measured dialysis.79 In 20% of their patients, the difference was clinically relevant. Quality assurance programs should take this into account by examining elements of the dialysis prescription, including blood volume processed, time on dialysis, and average flow rates during the nonmeasured treatments.
The ideal denominator for dialysis dosage among patients of varying size is the generation rate of uremic toxins because in a steady state of regular dialysis treatments, levels of toxins in the patient are likely to be directly proportional to their generation rates (and inversely proportional to clearance). Therefore, the increase in Kt/V caused by weight loss (lower V) in a dialysis patient with malnutrition likely is a false improvement in dialysis dose. No universally accepted adjustments currently are available to eliminate this potential error, but nephrologists should be aware of the pitfall and consider offering additional dialysis for patients with evidence of malnutrition. Because V is a measure of lean body mass and although using V as the denominator eliminates potential errors that might result from substituting weight in obese patients (presuming that fat is not a source of uremic toxins), it does not eliminate the potential error in malnourished patients. Similarly, an increase in edema fluid or possibly even muscle mass (if edema and muscle do not influence the generation of uremic toxins) is expected to decrease Kt/V, although toxin levels in the patient are not affected. Although some experts are opposed to the notion that delivered dialysis dose be scaled to patient size,80 it seems intuitive that a one-sized dialysis prescription does not fit all patient ages and sizes. However, it also is possible that the rate of toxin generation has more to do with diet or other factors than body size.
The patient's native kidneys provide functions that cannot be duplicated by the dialyzer and that contribute to patient survival.81 These benefits, most of which are poorly understood, are not reflected in small-solute clearances, even when adjusted for intermittence.
As dialysis frequency is increased, fluctuations in solute concentration are diminished, reducing the power of urea kinetic modeling and favoring dialysate methods for measuring the dose.