For patients managed with HD, both dialyzer and native kidney function can be measured periodically to assess the adequacy of replacement therapy. Urea clearance is the preferred measure of both (see Guideline 2).
2.1 Residual kidney urea clearance (Kr) is measured best from a timed urine collection.
2.2 For purposes of quality assurance, the delivered dose should be measured and compared with the prescribed dose each month.
Failure to include Kr in the model of urea kinetics will not harm the patient provided the dose of dialysis is adequate. Inclusion of Kr is advantageous because it allows accurate measurement of G and nPCR (or nPNA), which otherwise are underestimated in patients with significant RKF and are helpful to assess dietary adequacy. Inclusion of Kr also allows a potential reduction in the duration and frequency of dialysis as a means of improving QOL by extending time off dialysis. Limiting time and reducing the intensity of dialysis may benefit some more than others, depending on lifestyle and treatment tolerance. Mathematical analysis of solute kinetics during and between HD treatments shows that average and peak solute levels are controlled better by continuous (compared with intermittent) clearance, and that increasing the frequency of a given weekly clearance also lowers levels of dialyzable solutes. Comparison of delivered dose with prescribed dose of dialysis adds another dimension to the analysis of adequacy that can spot problems with the blood access device and dialysis equipment, including blood and dialysate pumps. This function is independent of the determination of adequacy.
Adding RKF to Dialyzer Clearance
If Kr is included in the dialysis prescription, it becomes important to measure Kr frequently to avoid prolonged periods of underdialysis as Kr is lost. The rate of loss may vary among patients. In some patients, monthly measurements are advised, whereas in others with good urine output, quarterly measurements will suffice. If infrequent measurements are chosen, the patient and dialysis staff must be alert to changes in urine output and exposure to toxic insults (see Table 16, CPR 6). Urine output roughly correlates with RKF, but it should not be used as the sole determinant because it does not predict RKF accurately in individual patients.81 Patients with potentially recoverable renal function represent a special group in whom regular measurements of RKF are especially advantageous. Failure to follow up RKF closely may lead to unnecessary prolongation or perpetuation of dialysis in a patient with adequate native kidney function who does not require dialysis.
For both PD and HD, the preferred measure of RKF is urea clearance. This differs from recommended measures of kidney function in patients with CKD stages 1 to 4, for whom creatinine clearance has been the traditional index, as well as the serum creatinine–based estimate of GFR derived from the MDRD Study.263 Reasons for recommending urea clearance as opposed to other techniques include the following:
When Kr is included in the expression of overall excretory function, the method for combining intermittent dialyzer clearance with continuous Kr requires some effort. Methods for adding Kr to Kd should take into account the additional clearance that RKF provides between dialysis treatments and the increased efficiency of continuous (compared with intermittent) clearance. Suggested methods for combining Kr with Kd can be found in Appendix. Caution must be exercised when using any of the methods found in the Appendix to adjust the dialysis dose for Kr values above 2 mL/min. Other potentially vital benefits of dialysis must be considered when contemplating a reduction in dose based solely on urea kinetics. An alternative simplified method (using a table) for adjusting spKt/V in patients with Kr> 2 mL/min/1.73 m2 can be found in CPR 4, Minimally Adequate Hemodialysis.
It is important to note that the adequacy standards described in these guidelines and CPRs that refer to dialysis-session-based spKt/V values do not include an adjustment for the continuous component of residual urea clearance.
One of the disadvantages of adjusting the HD dose according to RKF is the patient's perception of worsening health when the ultimate decrease in native kidney function requires longer treatment times. Successive prolongations of dialysis can contribute to psychological depression that further compromises the patient's QOL and, possibly, survival.32 Incremental dosing while counseling the patient to anticipate the increase in treatment time as renal function is lost is the Work Group's preferred approach.
How to Measure More Frequent Dialysis
The correction for rebound at the end of dialysis (see previous discussion of eKt/V) reduces, but does not eliminate, the effect of intermittence and disequilibrium on dialysis efficiency. Efficiency is defined as the effect of lowering solute concentration achieved for a given level of dialysis dose. Because the dose is defined as a clearance, the solute level is inversely proportional to the dose and the relationship between the 2 is curvilinear, eventually reaching a plateau of effectiveness as dialysis dose is increased. Intermittent dialysis therefore, in contrast to continuous dialysis, has a self-limiting aspect that diminishes its efficiency. If the efficiency of continuous dialysis is defined as unity, then the efficiency of thrice-weekly dialysis has been estimated as 0.7 or less, depending on the solute. The greater the solute disequilibrium, the lower the efficiency of intermittent dialysis. Increasing the frequency, ie, moving toward a more continuous pattern, increases efficiency. An adjustment in dose therefore theoretically is necessary to account for the improvement in efficiency for dialysis schedules that are more frequent than 3 times per week. This concept is inherent in the already accepted dictum that the same weekly dose given once or twice weekly will not suffice to maintain HD adequacy.
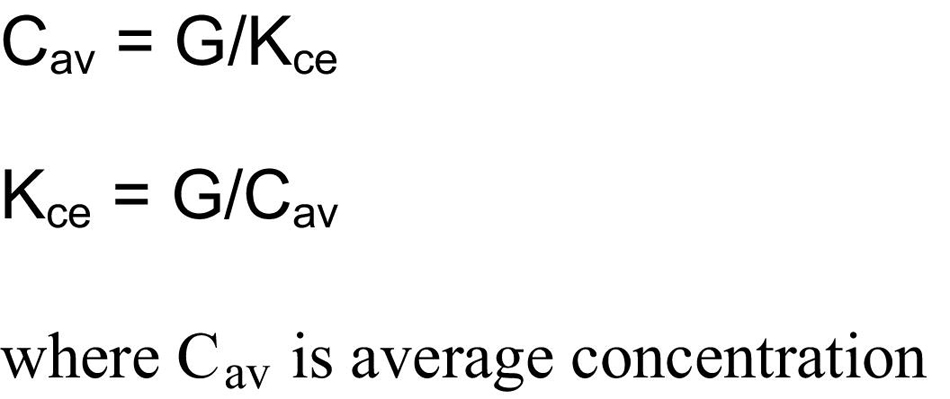
The recommended method for normalizing and expressing the dose of dialysis independent of frequency is to reduce the expressed delivered dose to a continuous equivalent clearance.202,264,265 This method relies on calculated average or peak concentrations of the index solute and assumes a weekly steady state of generation and removal. Under such conditions, the solute removal rate will equal the generation rate. In addition, the well-known relationship between clearance and concentration dictates that the average solute level will be proportional to the generation rate and inversely proportional to the continuous equivalent clearance (Kce):
The value of Kce for urea is calculated easily by using formal urea modeling that produces both G and time-averaged C (TAC).264 However, the resulting clearance is significantly higher than a consensus-derived continuous equivalent clearance for PD. This observation led 2 groups to propose using the average peak or average predialysis urea concentrations as the target instead of mean concentration.265,266 This substitution of a higher concentration than Cav in the expressions resulted in a lower average clearance, more in keeping with the accepted continuous peritoneal clearances for CAPD. The resulting quasiclearance was called “standard K” and “standard Kt/V” (stdKt/V).265 Another proposed approach is to model the kinetics of other solutes because almost all other small and large dialyzable solutes have greater disequilibrium than urea.267,268 As noted, the inefficiency of intermittent dialysis is accentuated by disequilibrium. All these methods produced a set of curves relating spKt/V to stdKt/V or normalized Kt/V that were similar, partially because parameters were chosen in each case to “force” the resulting continuous equivalent clearance to match the accepted values for continuous PD (CAPD). stdKt/V is calculated easily by using formal urea kinetic modeling and has been chosen by the NIH-sponsored Frequent HD Network as the frequency-normalized expression to monitor dialysis doses in their study of daily HD outcomes.
Conversion of spKt/V to stdKt/V can be approximated by using an explicit equation that assumes a symmetric weekly schedule of dialyses, no Kr, and a fixed volume (V). This method was presented first by Gotch in 1998 and later refined by Leypoldt in 200471:
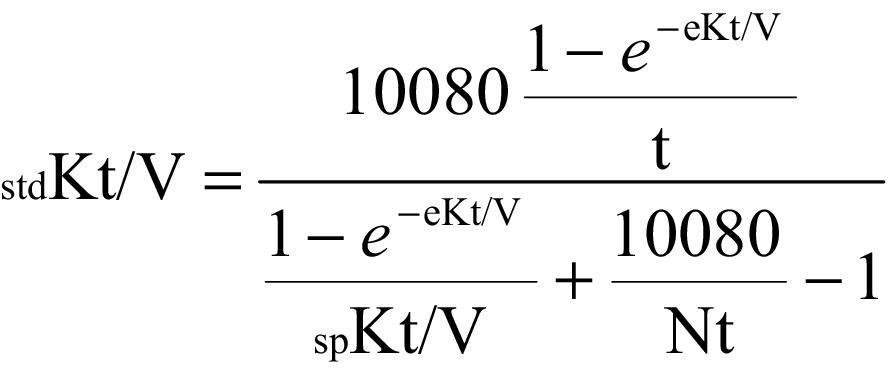
where N is number of treatments per week and eKt/V is derived from spKt/V by using 1 of the expressions in Table 4. It should be noted that stdKt/V calculated using this equation may differ slightly from stdKt/V calculated using the more exact method described previously that takes into account other variables, such as ECF volume expansion/contraction, asymmetry of the weekly schedule, and Kr.
The complexities of normalizing more frequent HD to a continuous equivalent clearance perhaps have contributed to a lack of consensus about dose expressions for the increasingly popular schedule of 4 treatments per week. The extra dialysis treatment often helps with management of larger patients, patients with refractory anemia, and patients with excessive fluid gains. Most of these methods require formal kinetic modeling and modeling programs that are not locked into 3 treatments per week. In addition, regulatory agencies have not caught up with these concepts and continue to demand a minimum Kt/V of 1.2 per dialysis as if they are given 3 times per week. If an extra dialysis treatment is given, a simple mathematical calculation shows that the minimum dose per dialysis required if the minimum for 3 times per week is 1.2 per dialysis is 0.9 per dialysis to achieve the same weekly clearance. This calculation assumes that all dialysis treatments are equal and the extra treatment produces no gain in efficiency. This conservative calculation will provide more dialysis for the patient than is apparent from the expressed dose, which effectively protects the patient from underdialysis. Alternatively, the dialysis clinic can simply multiply the measured Kt/V by 4 and divide by 3 to obtain the equivalent of Kt/V for 3 treatments per week.
Quality Assurance
The Work Group continues to recommend comparisons of prescribed with delivered doses as a quality assurance aid. Guideline 4 provides a minimum Kt/V threshold below which action should be taken to prevent underdialysis. However, even if the dose is adequate, comparison of prescribed with delivered dose has potential additional benefit for the patient. If sgnificantly different (>15% difference), troubleshooting should be done to detect other problems that may impact on future dosing, such as AR or a faulty blood pump. In practice, comparison of prescribed with delivered dose is accomplished by comparing modeled V with real V. The latter is determined preferably by averaging previous values of modeled V, but also can be determined by using an anthropometric formula, eg, Watson.269 If a problem exists with delivery, usually modeled V is significantly greater than real V. Because urea modeling provides a ratio of K/V, the inflated V is caused by an inordinately high prescribed K compared with delivered K. Prescribed K is determined from the dialyzer specification, K0A, and flow rates, whereas modeled K/V is determined mainly from changes in BUN levels during the dialysis. Comparison of modeled V with a previously determined patient-specific value for V is equivalent to comparing delivered with prescribed clearance. When V is too high, efforts should be made to detect such problems as AR, an error in dialysis timing, inadequate blood pump occlusion or calibration, faulty dialysate pump, error in blood sampling, or inadequate performance of the dialyzer (eg, because of clotting during dialysis or excessive reuse).