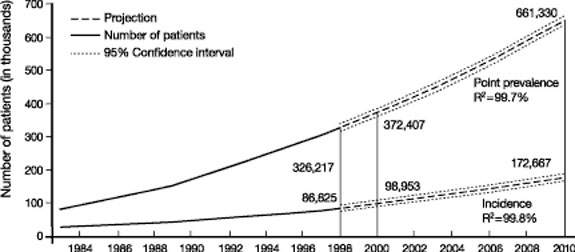
CKD is a world-wide public health problem. Figure 10 shows the increasing incidence and prevalence of kidney failure treated by dialysis and transplantation in the United States.2 The prevalence is projected to increase from 340,000 in 1999 to 651,000 by 2010. There is an even higher prevalence of earlier stages of CKD. The NKF-K/DOQI Clinical Practice Guidelines on Chronic Kidney Disease estimated that approximately 11% of the US adult population has CKD.1
Fig 10. Kidney failure in the United States. Incidence and prevalence of kidney failure treated by dialysis and transplantation (end-stage renal disease) in the United States. Incident patients refers to new cases during the year. Point prevalent patients refers to patient alive on December 31st of the year. Solid vertical lines represent complete data for 1998 and expected data for 2000. Projections for future years are based on extrapolation of regression equations. R2 for regression equations is given. From USRDS 2000 Annual Data Report.2
Hypertension is a common complication of CKD, which increases the risk for the two main outcomes of CKD: loss of kidney function sometimes leading to kidney failure, and CVD, both associated with increased mortality. Appropriate evaluation and management of hypertension and use of antihypertensive agents in CKD offers the opportunity to slow the progression of kidney disease and reduce the risk of CVD.
The Work Group defined three principal goals of antihypertensive therapy in CKD: lowering blood pressure, slowing progression of CKD, and reducing the risk of CVD. The Work Group also recommended considering reducing proteinuria an additional therapeutic goal. This section provides the background for consideration of targets for antihypertensive therapy to achieve these goals in CKD.
Hypertension affects approximately 50 million individuals in the United States and 1 billion individuals worldwide. Hypertension is one of the major risk factors for the development and progression of CKD and CVD. Prevention, detection, evaluation, and treatment of high blood pressure are major public health goals.
The National Heart, Lung, and Blood Institute (NHLBI) administers the National High Blood Pressure Education Program Coordinating Committee, a coalition of professional, public, and voluntary organizations, and federal agencies. One important program function of the coalition is to issue guidelines and advisories designed to increase awareness, prevention, treatment, and control of hypertension. The Sixth Report of the Joint National Committee on Prevention, Detection, Evaluation, and Treatment of High Blood Pressure (JNC 6 Report) was issued in 1997.15 During the time of the NKF-K/DOQI Work Group’s deliberations, NHLBI convened JNC 7 to update the recommendations. The NKF is a member organization of the Committee, and two members of the Work Group (G.L.B. and T.H) contributed to the JNC 7 report, which was published in brief form in May 20035 and in full detail in December 2003.5a The recommendations of this Work Group and JNC 7 related to CKD are consistent with each other, and represent a broad consensus for blood pressure management and the use of antihypertensive agents in CKD.
Definition of Hypertension
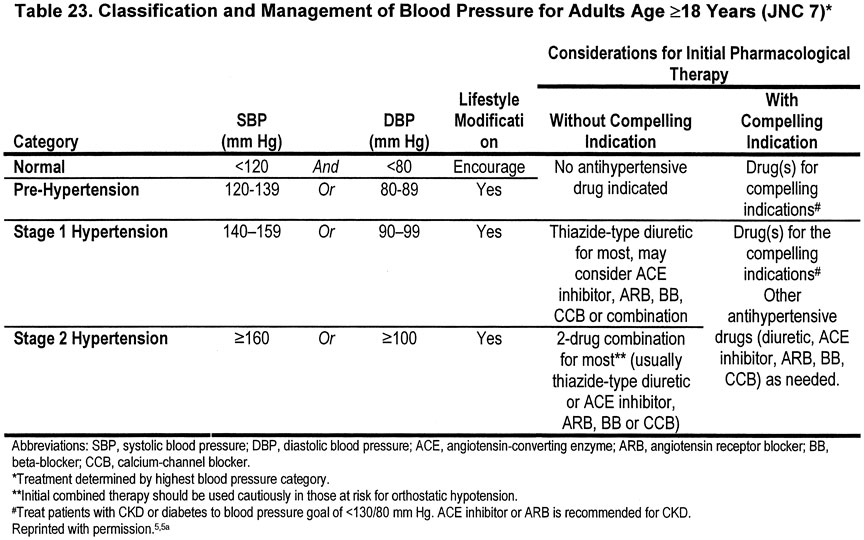
Table 23 shows the JNC 7 classification and management of blood pressure levels in adults. Hypertension is defined as an SBP or DBP ≥140 mm Hg or ≥90 mm Hg, respectively. In children, hypertension is defined as a blood pressure >95th percentile for height and gender. Throughout the spectrum of elevated blood pressure levels, higher stages are associated with increased risk of "target-organ damage or clinical CVD," specifically heart diseases (left ventricular hypertrophy, angina or prior myocardial infarction, prior coronary revascularization, or heart failure), stroke or transient ischemic attack, CKD, peripheral arterial disease, and retinopathy.
Key Messages From JNC 7 Report
These messages, taken verbatim from JNC 7, reflect a number of substantive changes from JNC 6. For the NKF-K/DOQI Work Group, the most important changes were (1) the acknowledgement that GFR <60 mL/min/1.73 m2 or microalbuminuria (both criteria for the definition of CKD) as independent risk factors for CVD, and (2) the designation of CKD as a "compelling indication" for antihypertensive therapy, which affects both the blood pressure target and the choice of antihypertensive agents.
In persons over age 50, SBP >140 mm Hg is an extremely critical and more important CVD risk factor than DBP.
The risk of CVD, beginning at 115/75 mm Hg, doubles with each increment of 20/10 mm Hg; individuals who are normotensive at age 55 have a residual 90% lifetime risk for developing hypertension.
Individuals with a SBP of 120 to 139 mm Hg or a DBP of 80 to 89 mm Hg should be considered as prehypertensive and require health-promoting lifestyle modifications to prevent CVD.
Thiazide-type diuretics should be used as initial drug therapy for most patients with hypertension, either alone or combined with drugs from other classes. Certain high-risk conditions are compelling indications for the initial use of other antihypertensive drug classes (angiotensin-converting enzyme inhibitors, angiotensin receptor blockers, beta-blockers, calcium-channel blockers).
Most hypertensive patients will require two or more antihypertensive medications to achieve goal blood pressure (<140/90 mm Hg, or <130/80 mm Hg for patients with diabetes or CKD).
If blood pressure is >20/10 mm Hg above the target blood pressure, consideration should be given to initiating therapy with two agents, one of which usually should be a thiazide-type diuretic.
The most effective therapy prescribed by the most careful clinician will control hypertension only if patients are motivated. Motivation improves when patients have positive experiences with, and trust in, the clinician. Empathy builds trust and is a potent motivator.
In presenting these guidelines, the committee recognizes that the responsible physician’s judgment remains paramount.
Initiation and Progression of CKD
Model of CKD. Figure 11 is a conceptual model of the course of CKD, which defines stages of CKD as well as antecedent conditions, outcomes, risk factors for adverse outcomes, and actions to improve outcomes.
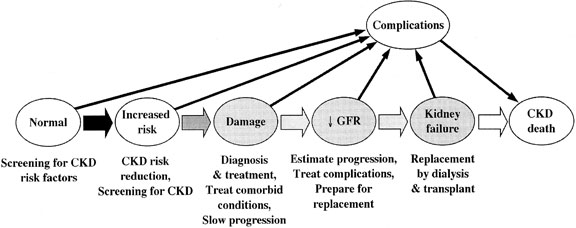
Fig 11. Conceptual model for stages in the initiation and progression of CKD, and therapeutic interventions. Shaded ellipses represent stages of CKD; unshaded ellipses represent potential antecedents or consequences of CKD. Thick arrows between ellipses represent "risk factors" associated with initiation and progression of disease that can be affected or detected by interventions: susceptibility factors (black); initiation factors (dark gray); progression factors (light gray); and end-stage factors (white). Interventions for each stage are given beneath the stage. Individuals who appear normal should be screened for CKD risk factors. Individuals known to be at increased risk for CKD should be screened for CKD. Complications refer to all complications of CKD and its treatment, including complications of decreased GFR (hypertension, anemia, malnutrition, bone disease, neuropathy, and decreased quality of life) and cardiovascular disease (see text). Reprinted with permission.1 Abbreviations: CKD, chronic kidney disease; GFR, glomerular filtration rate.
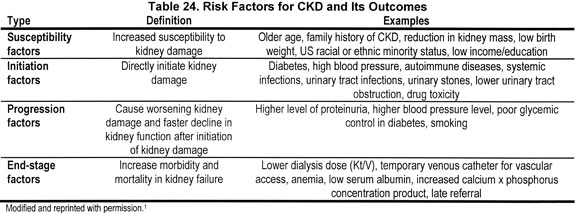
CKD risk factors. CKD risk factors are defined as attributes associated with increased risk of adverse outcomes of CKD (Table 24). Therapeutic interventions at earlier stages can prevent or ameliorate some of the complications of decreased kidney function, as well as slow the progression to kidney failure. Thus, measures to improve prevention, detection, and treatment of CKD in its earlier stages could reduce adverse outcomes due to CKD.
Definition, Stages, and Types of CKD and Importance of Proteinuria
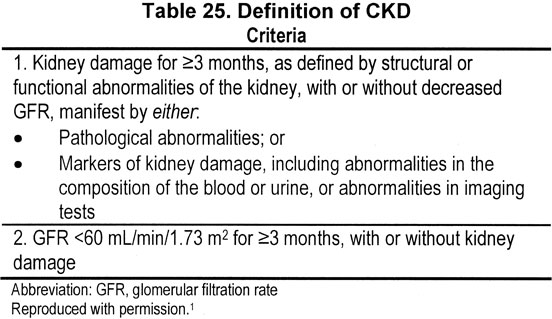
Definition of CKD. CKD is defined as kidney damage, as confirmed by kidney biopsy or markers of damage, or glomerular filtration rate (GFR) <60 mL/min/1.73 m2 for ≥3 months (Table 25). Guideline 2 reviews evaluation for proteinuria, other markers of kidney damage, and estimation of GFR from measurements of serum creatinine and prediction equations.
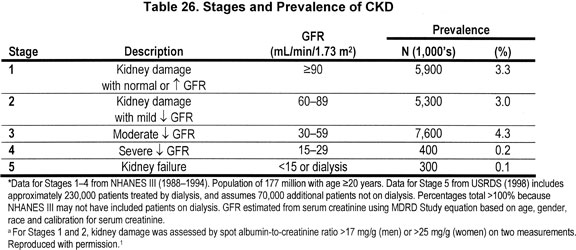
Stages of CKD. Among individuals with CKD, the stage of disease is based on the level of GFR (Table 26), irrespective of the cause of kidney disease. Using these definitions, the prevalence of CKD and levels of GFR in the United States were estimated from the Third National Health and Nutrition Examination Survey (NHANES III) database and the US Renal Data System (USRDS).1,16,17 Approximately 11% of adults in the United States have CKD. The prevalence of kidney failure (Stage 5, approximately 300,000, 0.1%) is less than 1% of the prevalence of earlier stages of CKD (Stages 1-4, approximately 20 million, 10.8%).
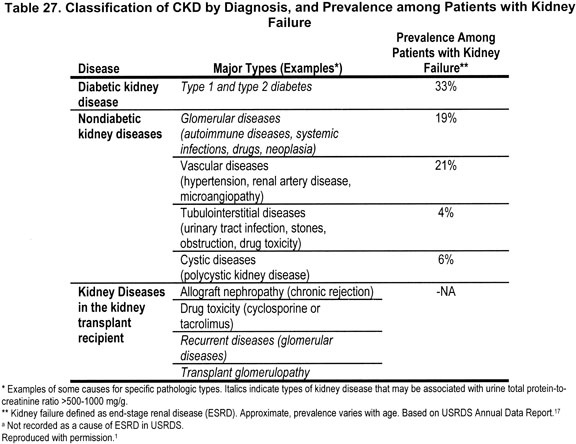
Types of CKD. Diagnosis of the type of CKD is important for evalution and management of hypertension and use of antihypertensive agents. Diagnosis is based on pathology and etiology (Table 27). Definitive diagnosis is based on biopsy or imaging studies. However, biopsy and invasive imaging procedures are associated with a risk of small, but potentially serious complications. In most patients, well-defined clinical presentations and causal factors provide a sufficient basis to assign a diagnosis of CKD without these procedures. A more detailed description of clinical features to distinguish types of CKD is given in Guidelines 8, 9, 10, 11.
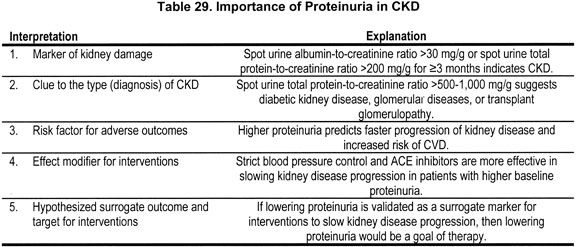
Importance of Proteinuria
Proteinuria refers to increased excretion of specific proteins, predominantly albumin, or total urine protein. The definition of proteinuria is shown in Table 28.
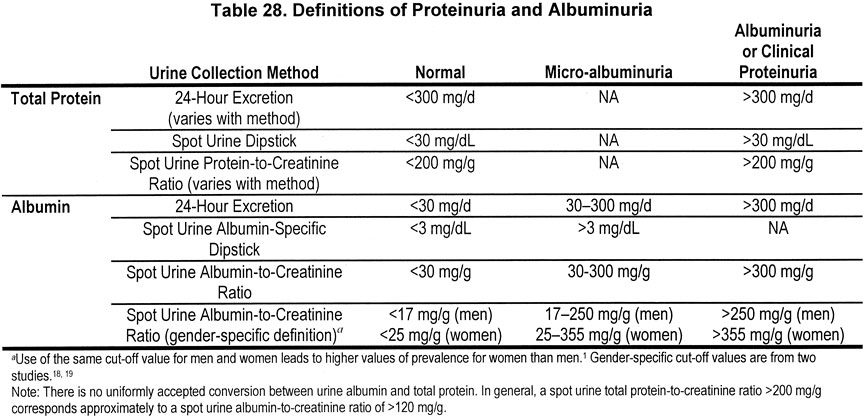
Proteinuria is a common finding in CKD, and appropriate measurement and interpretation of proteinuria are important in antihypertensive therapy in CKD (Table 29). First, proteinuria is a marker of kidney damage; the presence of proteinuria for ≥3 months defines the presence of CKD (Table 25). Second, the level of proteinuria is an important diagnostic finding. In particular, a high level of proteinuria (for example, a total urine protein-to-creatinine ratio >500 to 1,000 mg/g) suggests diabetic kidney disease, a nondiabetic glomerular disease, or a glomerular disease in the transplant. Third, the level of proteinuria is also an important prognostic finding. As discussed subsequently, higher levels of proteinuria are associated with faster progression of kidney disease and an increased risk of CVD. Higher levels of proteinuria also identify patients who benefit more from antihypertensive therapy, including a lower blood pressure goal and selected antihypertensive agents. Finally, the available evidence allows for the hypothesis that an increase in proteinuria is a surrogate outcome for kidney disease progression. If this hypothesis is validated, then lowering proteinuria would become a goal for therapy.
Risk Stratification in CKD
Risk for adverse outcomes of CKD (progression of kidney disease or development of CVD) depends on the stage of kidney disease, type of kidney disease, and level of proteinuria.20 Figures 12 and 13 show schematic representations of the relationships among risk, stage and type of kidney disease, and level of albuminuria. As discussed subsequently, the type of kidney disease and the level of proteinuria influence the selection are antihypertensive agents and blood pressure goals in CKD. In principle, many other factors contribute to risk stratification, and may guide other therapeutic interventions.
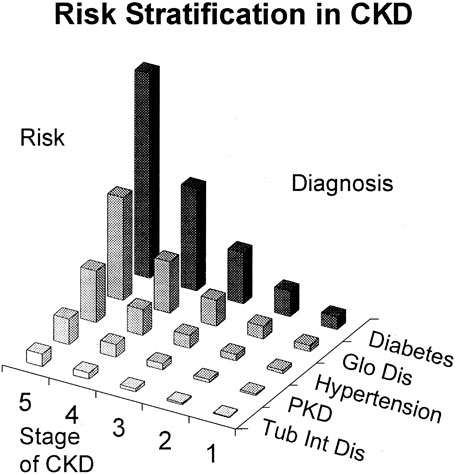
Fig 12. Relationship of stage and type of kidney disease to prognosis in CKD. Vertical axis shows hypothetical risks for adverse outcomes of CKD, such as progression to kidney failure or onset of CVD. Left axis shows stage of CKD, based on NKF-K/DOQI classification shown in Table 26. Right axis shows classification of clinical-pathological type of CKD (diagnosis), based on the classification shown in Table 27. Risk profiles differ for progression to kidney failure and onset of CVD. Abbreviations: Glo Dis, glomerular diseases; PKD, polycystic kidney disease; Tub Int Dis, tubulointerstitial diseases.
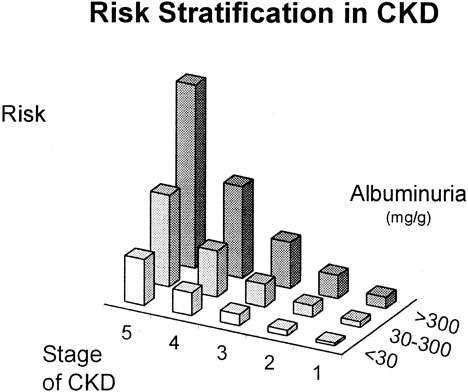
Fig 13. Relationship of stage of kidney disease and level of albuminuria to prognosis in CKD. Vertical axis shows hypothetical risks for adverse outcomes of CKD, such as progression to kidney failure or onset of CVD. Left axis shows stage of CKD, based on NKF-K/DOQI classification shown in Table 26. Right axis shows magnitude of albuminuria, measured as spot urine albumin-to-creatinine ratio (mg/g). Risk profiles differ for progression to kidney failure and onset of CVD. Stratification of risk by CKD stage and albuminuria applies to patients in whom the cause of CKD is known, such as glomerular diseases or polycystic kidney diseases, or in whom the cause of CKD is not known. (Patients with CKD Stage 1-2 and albuminuria <30 mg/g have another marker of kidney disease, such as hematuria for patients with glomerular diseases or cysts for patients with polycystic kidney disease.)
Relationship of Hypertension to Stages of CKD
Hypertension is a common clinical finding in CKD; however, it is not part of the definition of CKD. Table 30 illustrates the classification of individuals based on presence or absence of kidney damage, level of GFR, and presence or absence of hypertension. Shaded areas indicate individuals with CKD; unshaded areas indicate individuals without CKD. Because of the age-related rise in blood pressure and decline in GFR, "high blood pressure" and "high blood pressure with decreased GFR" are common in the elderly. Determining whether elderly individuals with hypertension and decreased GFR have CKD requires assessment for markers of kidney damage (for example, measurement of urine protein, urinalysis with urine dipstick or sediment examination, or imaging studies of the kidneys).

Prevalence of Hypertension in CKD
Figure 14 shows the prevalence of hypertension by level of GFR among 15,600 participants in NHANES III. Overall, approximately 50% to 75% of individuals with GFR <60 mL/min/1.73 m2 (CKD Stages 3-5) had hypertension. The prevalence of JNC Stage ≥1 hypertension among individuals with GFR <30 mL/min/1.73 m2 is approximately 75%, and similar to that observed in other studies.21 The approximately 40% prevalence of JNC Stage ≥1 hypertension among individuals with GFR of >60 mL/min/1.73 m2 may be an underestimate, because not all patients with GFR in this range in NHANES III had CKD (that is, markers of kidney damage).
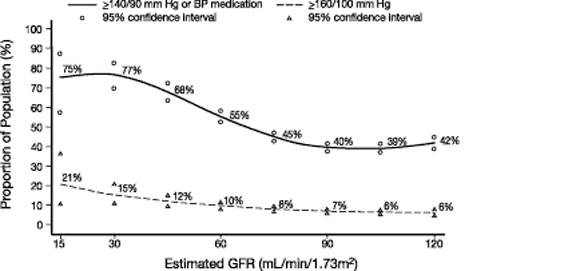
Fig 14. Prevalence of high blood pressure by level of GFR, adjusted to age 60 years in NHANES III. GFR was estimated using the abbreviated MDRD Study equation. Hypertension was defined as JNC ≥Stage 1 (SBP ≥140 mm Hg or DBP ≥90 mm Hg, or taking medications for hypertension) or JNC ≥Stage 2 (SBP ≥160 or DBP ≥100 mm Hg). Values are adjusted to age 60 years using a polynomial regression. 95% confidence intervals are shown at selected levels of estimated GFR. Reproduced with permission.1
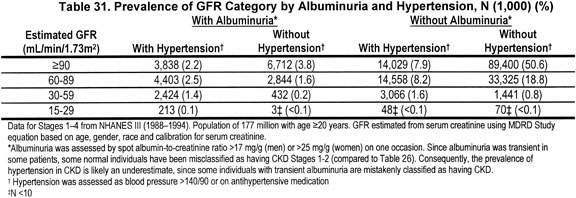
Table 31 shows the proportion of individuals with hypertension or with albuminuria on a single spot urine specimen by GFR level. At all levels of GFR, the proportion of individuals with hypertension (compared to those without hypertension) is greater in those with albuminuria compared to those without albuminuria.
Causes of Hypertension in CKD
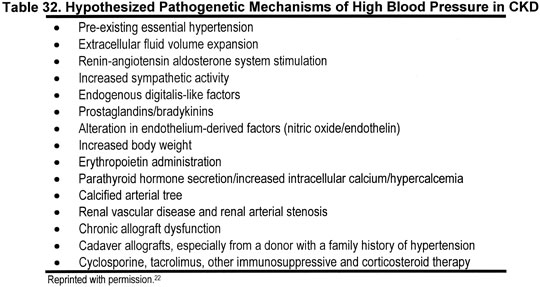
Several of the abnormalities that develop in CKD contribute to the increased prevalence of hypertension. The clinically more important pathogenetic mechanisms of hypertension are listed in Table 32.22
Hypertension Control in CKD
An analysis of the NHANES III database assesses the level of blood pressure control among individuals with decreased kidney function.23 Decreased kidney function was defined as an elevated serum creatinine (≥1.6 mg/dL in men or ≥1.4 mg/dL in women).
Figures 15 and 16 show the prevalence and number of individuals with elevated serum creatinine among patients receiving and not receiving antihypertensive therapy, according to JNC blood pressure category. Overall, 13% of treated individuals and 1.6% of untreated individuals had elevated serum creatinine. The largest number of treated and untreated individuals with elevated serum creatinine had JNC Stage 1 hypertension (approximately 1.1 and 0.5 million, respectively).

Fig 15. Prevalence of elevated serum creatinine by JNC 6 blood pressure category and self-reported treatment with antihypertensive medications in NHANES III. Bars indicate standard errors. Elevated serum creatinine defined as ≥1.6 mg/dL in men or ≥1.4 mg/dL in women. Reprinted with permission from Archives of Internal Medicine.23
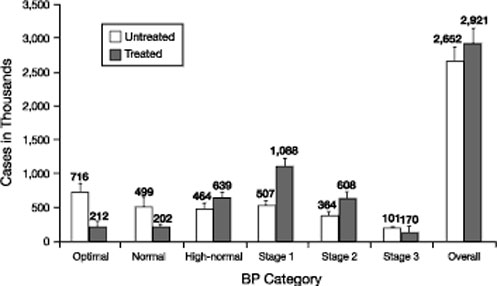
Fig 16. Estimated number of individuals with elevated serum creatinine by JNC 6 blood pressure category and self-reported treatment with antihypertensive medications (NHANES III). Bars indicated standard errors. Reprinted with permission.23
Altogether, an estimated 3% (5.6 million) of the US adult population had elevated serum creatinine according to this definition, and 70% of them had hypertension. Among individuals with decreased kidney function and hypertension, 75% received treatment. However, only 11% of individuals with hypertension and elevated serum creatinine had blood pressure <130/85 mm Hg, and only 27% had blood pressure <140/90 mm Hg. Treated individuals had a mean blood pressure of 147/77 mm Hg, with 48% prescribed only one antihypertensive medication. These data underscore the need for additional efforts, including multidrug therapy, to lower blood pressure.
Initiation and Progression of CVD
Model of CVD. The 1998 Report of the NKF Task Force on CVD in Chronic Renal Disease concluded that patients with CKD be considered in the "highest-risk" group for subsequent CVD events, and that most interventions that are effective in the general population should also be applied to patients with CKD.3,4 Figure 17 is a conceptual model of the course of CVD in the general population, modified from that developed by the Task Force,1 analogous to the model of CKD in Fig 11. Although there may be some differences between the general population and patients with CKD in the course of CVD, this model can be used to analyze factors for initiation and progression of CVD in CKD.
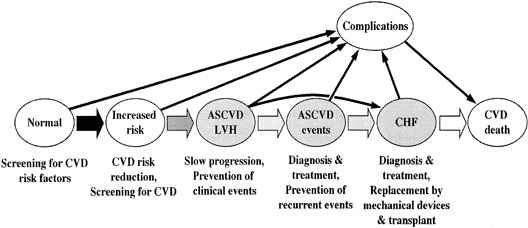
Fig 17. Conceptual model for stages in the initiation and progression of CVD, and therapeutic interventions in the general population. Shaded ellipses represent stages of CVD; unshaded ellipses represent potential antecedents or consequences of CVD. Thick arrows between ellipses represent "risk factors" associated with initiation and progression of disease that can be affected or detected by interventions: susceptibility factors (black); initiation factors (dark gray); progression factors (light gray); and end-stage factors (white). Interventions for each stage are given beneath the stage. Individuals who appear normal should be screened for CVD risk factors. Individuals known to be at increased risk for CVD should be screened for CVD. Complications refer to all complications of CVD and its treatment. Reprinted with permission.1 Abbreviations: CVD, cardiovascular disease; ASCVD, atherosclerotic CVD; LVH, left ventricular hypertrophy; CHF, congestive heart failure.
Increased Risk of CVD in CKD
As in the general population, CVD accounts for 40% to 50% of all deaths in CKD. The Task Force highlighted the high mortality of dialysis patients compared to the general population (Fig 18).24 These high mortality rates appear to be due to high prevalence rates of CVD, as well as high case fatality rates. Similar results have been reported in kidney transplant recipients (Fig 19)24 and in individuals with diabetic and nondiabetic kidney disease.1
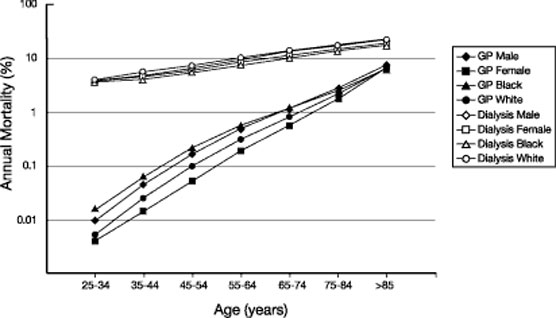
Fig 18. CVD mortality in dialysis patients (USRDS) compared to the general population (NCHS). CVD mortality defined by death due to arrhythmias, cardiomyopathy, cardiac arrest, myocardial infarction, atherosclerotic heart disease, and pulmonary edema in the general population (GP), data from NCHS multiple cause of mortality data files (ICD 9 codes 402, 404, 410-414, and 425-429, 1993) compared to dialysis patients (data from USRDS special data request. HCFA form 2746, #s 23, 26-29, and 31, 1994-1996). Data are stratified by age, sex, and race. Reproduced with permission.24
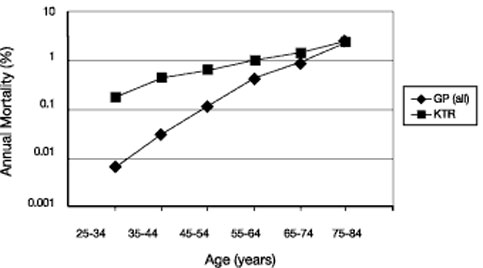
Fig 19. CVD mortality in kidney transplant recipients (USRDS) compared to the general population (NCHS). CVD mortality defined by death due to arrhythmias, cardiomyopathy, cardiac arrest, myocardial infarction atherosclerotic heart disease, and pulmonary edema in the general population (GP) (data from NCHS multiple cause of mortality data files). ICD 9 codes 402, 404, 410-414, and 425-429, 1993 compared to kidney transplant recipients (data from USRDS special data request. HCFA form 2746, #s 23, 26-29, and 31, 1994-1996). Data are stratified by age. CVD mortality is underestimated in kidney transplant recipients (KTR) due to incomplete ascertainment of cause of death. Reproduced with permission.24
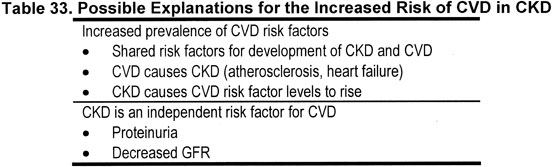
The explanation for the increased risk of CVD in CKD is not clear (Table 33), although coexisting hypertension is a likely cause. Because of the high absolute risk of CVD in CKD, the NKF Task Force Report, CKD Guidelines, and a recent scientific statement from the American Heart Association7 recommend that all individuals with CKD should be considered in the "highest-risk" group for CVD, irrespective of levels of traditional CVD risk factors.
CVD Risk Factors in CKD
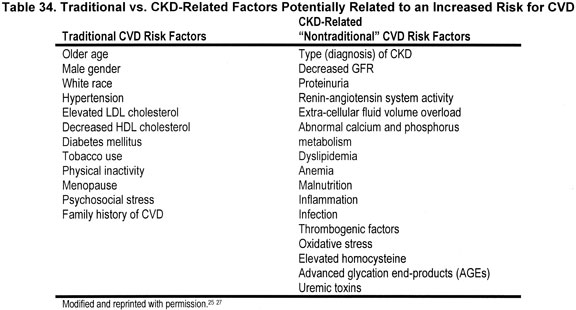
Table 34 shows a partial list of risk factors potentially associated with CVD in CKD.25 "Traditional" risk factors are those variables defined in the general population through prospective cohort studies, such as the Framingham Heart Study. A number of traditional risk factors increase in prevalence and severity with increasing proteinuria or decreasing GFR (CKD Guideline 15).1 A number of "nontraditional" risk factors are related to CKD, including hemodynamic and metabolic abnormalities associated with CKD, and are sometimes referred to as "CKD-related CVD risk factors." Some authors have subdivided CKD-related CVD risk factors into those factors altered by the "uremic" state (for example, hypertension, dyslipidemia, homocysteine) and factors that are characteristic of the "uremic" state (for example, inflammation, malnutrition, anemia, oxidative stress, hyperparathyroidism, and increased calcium × phosphorus concentration product).26
CKD as an Independent Risk Factor for CVD
Both albuminuria and reduced GFR are associated with an increased prevalence of CVD risk factors, CVD surrogates such as carotid intima media thickness or left ventricular mass index, or CVD itself. Therefore, it is not surprising that CKD, without adjustment for other factors, is a risk factor for CVD outcomes in prospective studies. More recent studies, however, suggest that albuminuria and reduced GFR may also be independent risk factors for CVD outcomes, after adjustment for traditional CVD risk factors.7
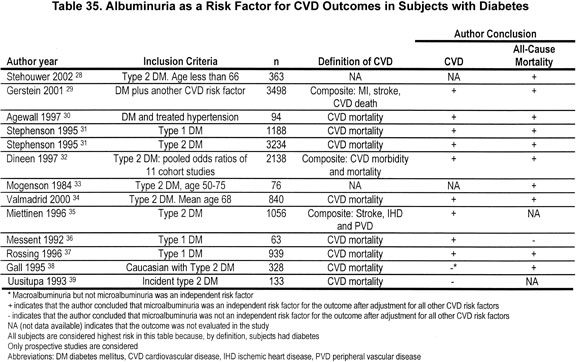
Albuminuria and proteinuria. Microalbuminuria has been shown to be an independent risk factor for CVD outcomes in subjects with diabetes (Table 35). One potential explanation for this finding is that microalbuminuria may be a marker of the severity of vascular damage from diabetes, reflecting generalized endothelial dysfunction and increased vascular permeability.
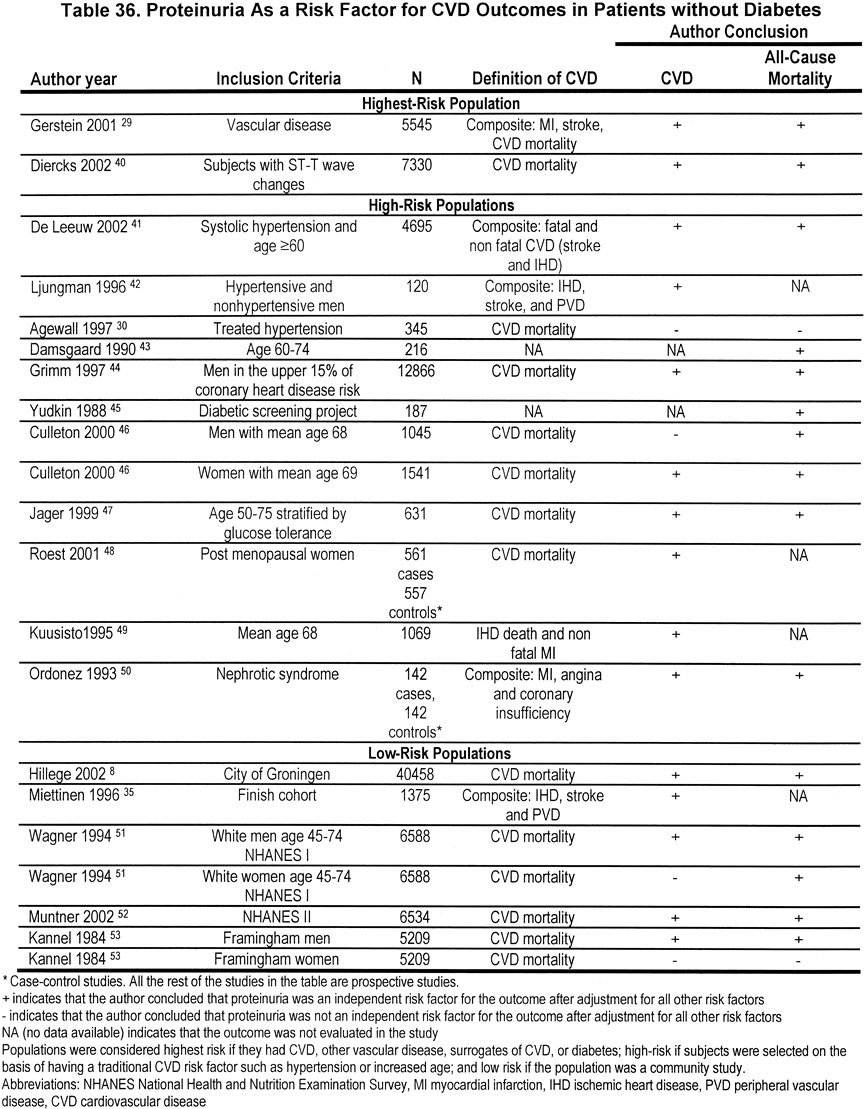
Higher levels of albuminuria and increased total protein are also an independent risk factor for CVD outcomes in most, but not all, studies of subjects without diabetes (Fig 208 and Table 36). This is particularly true in highest-risk populations (those selected for having either vascular disease or diabetes) and is also generally true in high-risk populations (those selected for having one or more traditional risk factor for CVD such as hypertension or increased age) and low-risk populations (community studies).
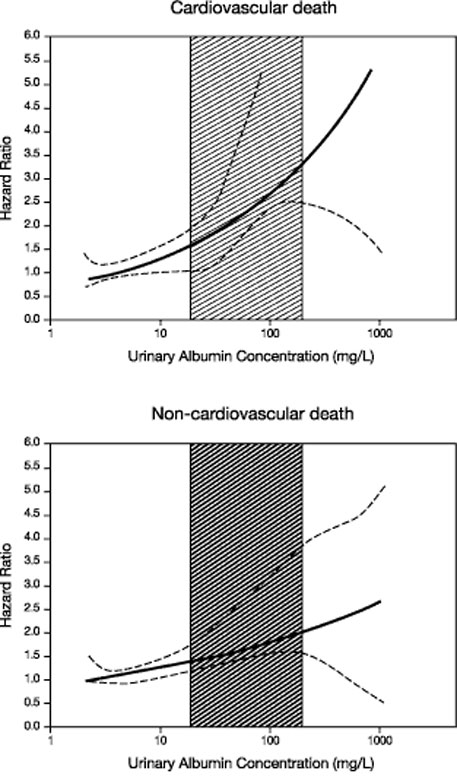
Fig 20. Albuminuria as a risk factor for CVD in individuals without diabetes. The adjusted effect of urinary albumin concentration (UAC) on hazard function in the Prevention of Renal and Vascular End Stage Disease (PREVEND) Study. The solid line shows the estimated relationship when logarithmic hazard is modeled as a linear function of log[UAC]. The dotted lines are 95% confidence limits for a more general functional relationship, as estimated by P-splines. The hatched area represents UAC of 20 to 200 mg/L, respectively, corresponding approximately to the definition of microalbuminuria. The graphs show that as UAC increases, the hazard ratios for both cardiovascular and noncardiovascular death increases. This increase begins in individuals with UAC in the microalbuminuria range. Reproduced with permission.8
Decreased GFR. Reduced GFR has consistently been found to be an independent risk factor for CVD outcomes in highest-risk populations (Table 37). In high-risk populations, most studies have suggested that reduced GFR is an independent risk factor for CVD outcomes, while in low-risk populations approximately half of studies have suggested that reduced GFR is an independent risk factor (Fig 21),9 while the other half have not. Therefore, reduced GFR appears to be a stronger and more consistent risk factor for CVD outcomes in subjects at higher risk for CVD.


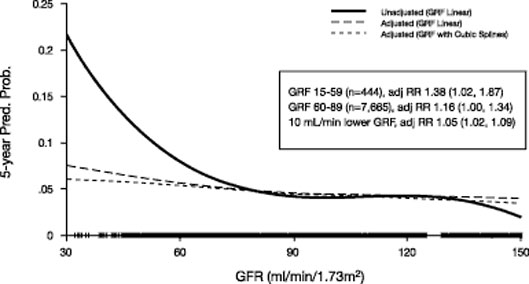
Fig 21. Decreased GFR as a risk factor for CVD. Five-year probability of CVD events according to baseline estimated GFR, as observed in 45- to 64-year-old individuals enrolled in the Atherosclerosis Risk in Communities (ARIC) Study. Hatch marks on the horizontal axis indicate the number of individuals with events at corresponding level of GFR. The large increase in risk for individuals with baseline GFR <60 mL/min/1.73 m2 is apparent. The increased risk is attenuated after adjustment for other known risk factors, but remains statistically significant. Reproduced with permission.9
The majority of studies have found that GFR levels of approximately <60 mL/min/1.73 m2 appear to be the breakpoint at which higher event rates are observed.7
Possible reasons why reduced GFR may be an independent risk factor for CVD include the following: First, reduced GFR may be associated with "residual confounding" from traditional risk factors such as age and hypertension. For example, the subject with reduced GFR may have had a more severe and longer exposure to hypertension than another subject with a similar blood pressure reading at one point in time. Second, reduced GFR is associated with many nontraditional CVD risk factors such as hyperhomocysteinemia, which may confound the relationship with CVD. Third, reduced GFR may be a marker of undiagnosed vascular disease, or alternatively a marker for the severity of diagnosed vascular disease. Fourth, subjects with reduced GFR may not be treated as aggressively with medications known to reduce CVD such as ACE inhibitors, beta-blockers, and aspirin.
Progressive Nature of CKD
Figure 22 shows a schematic diagram of the loss of kidney function over time in four hypothetical patients with CKD (A through D). It is evident that patients with a lower level of kidney function at the detection of CKD and with a faster decline in kidney function over time (D) reach kidney failure sooner (t1) than those with a higher level of kidney function at detection (B) or slower rate of GFR decline (C) (t2). On the other hand, patients with a higher level of kidney function at detection and a slower rate of kidney function decline (A) may not reach kidney failure during their lifetime. Thus, the objectives of therapy for CKD is to detect kidney disease at a higher level of GFR (open arrow) and to slow the decline in GFR thereafter (filled arrows).
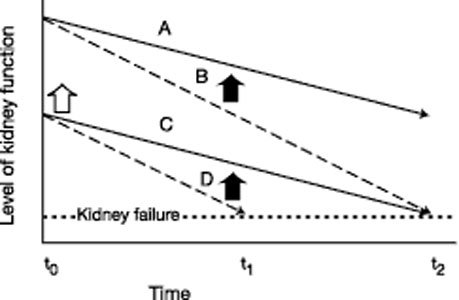
Fig 22. Kidney function decline in CKD. For explanation, see text. Reproduced with permission.1
Data from the MDRD Study during an average 2-year follow-up show a wide range in GFR decline (Fig 23). Approximately 85% of the patients had GFR decline during follow-up. The remaining patients experienced improvement or stabilization of GFR.98 The average rate of decline in GFR was approximately 4 mL/min/y and was not related to the baseline level of GFR. Other studies reviewed in the K/DOQI Guidelines on CKD ( Guideline 13) also show a wide range in the rates of decline in GFR or creatinine clearance among studies, as well as among individual patients.1 By comparison, the normal age-related decline in GFR for adults older than 20 to 30 years is 1 mL/min/1.73 m2 per year.

Fig 23. GFR slopes in the Modification of Diet in Renal Disease (MDRD) Study. The best linear unbiased estimates of GFR slope over 3 years in Study A or overall slopes in Study B are shown as a function of baseline GFR. The lower, middle, and upper lines represent the 10th, 50th, and 90th percentiles of the distribution of GFR slopes, respectively. The GFR slope estimates are not related to baseline GFR. Reprinted with permission.98
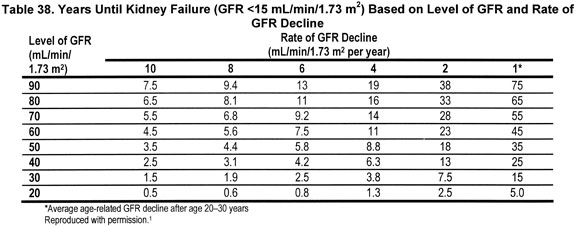
Table 38 shows the years until the development of kidney failure (GFR <15 mL/min/1.73 m2) for various combinations of baseline level of GFR and rates of GFR decline. For individuals with GFR <60 mL/min/1.73 m2, the interval until kidney failure is approximately 10 years or less if the rate of decline is ≥4 mL/min/1.73 m2 per year. The K/DOQI CKD Guidelines define rates of GFR decline ≥4 mL/min/1.73 m2 as "fast".1 Reduction in the rate of GFR decline to <2 mL/min/1.73 m2 per year could increase the interval until onset of kidney failure more than twofold. In the opinion of the Work Group, the therapeutic goal for strategies that slow the progression of kidney disease should be a GFR decline of <2 mL/min/1.73 m2 per year.
Hypertension and Related Factors as Risk Factors for Progression of Kidney Disease
Guideline 2 in this document and CKD Guideline 13 1 review risk factors associated with progression of kidney disease, as judged by a faster rate of GFR decline or increased risk of developing kidney failure. Modifiable factors include hypertension and proteinuria. Also, other mechanisms, such as increased activity of the renin-angiotensin system (RAS), may contribute to kidney disease progression through mechanisms in addition to hypertension and proteinuria (Fig 24).

Fig 24. Risk factors for kidney disease progression related to hypertension. Shaded ellipses represent stages of kidney disease (see Fig 2). Thick arrows between ellipses represent "risk factors" associated with progression of disease that can be affected by interventions. Thin arrows represent relationships between risk factors. Dashed lines indicate hypothesized relationships.
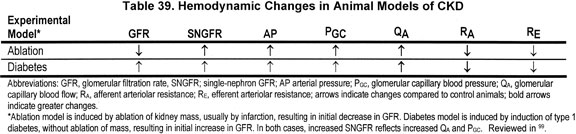
Hypertension as a risk factor for CKD progression. Clinical studies reviewed in CKD Guideline 13 1 demonstrate a strong, consistent relationship of higher levels of blood pressure to faster kidney disease progression. In part, this may be due to deleterious effects of higher intra-glomerular pressure (PGC).99 Intraglomerular pressure is determined by single nephron blood flow (QA), afferent arteriolar resistance (RA), and efferent arteriolar resistance (RE). In many animal models of CKD, intraglomerular pressure is increased due to increased single nephron blood flow and greater proportional reduction of afferent versus efferent arteriolar resistance (Table 39).99 These findings result in elevated singlenephron GFR (SNGFR), which in the short term may lead to stabilization or even increased GFR, but in the long term are followed by proteinuria, glomerular sclerosis, and kidney failure.
Proteinuria as a risk factor for CKD progression. Clinical studies demonstrate a strong, consistent relationship of higher levels of proteinuria to faster kidney disease progression. Proteinuria reflects increased permeability of the glomerular capillary to macromolecules, usually caused by glomerular damage. In some animal models of CKD, it has been demonstrated that proteinuria is associated with the release of inflammatory mediators, culminating in glomerular and tubulointerstitial fibrosis and kidney failure.100 Whether proteinuria is a causal factor in kidney disease progression in humans is not certain.
RAS activity as a risk factor for CKD progression. RAS has several effects on kidney function. In particular, angiotensin causes glomerular efferent arteriolar vasoconstriction leading to increased intraglomerular pressure, mesangial cell contraction leading to increased permselectivity to proteins, and stimulation of growth factors associated with fibrosis. It is difficult to assess RAS activity from clinical measurements; however, results from animal studies and controlled trials reviewed in Guidelines 8, 9, 10, and 11 show beneficial effects from blockade of RAS on progression of kidney disease of various causes.
Mechanisms of Action of Antihypertensive Agents in Slowing Progression of CKD
Controlled trials reviewed in Guidelines 8 and 9 demonstrate the causal role of hypertension in progression of kidney disease in humans. Classes of antihypertensive agents differ in their effects on systemic and glomerular pressures (Fig 25). In the absence of antihypertensive therapy, both systemic and glomerular pressures are increased in experimentally induced kidney disease (the top panel). Direct-acting vasodilators dilate the afferent arteriole, lowering systemic pressure more than glomerular pressure (middle panel), whereas ACE inhibitors and ARBs selectively dilate the efferent arteriole lowering both systemic and glomerular capillary pressure (lower panel).
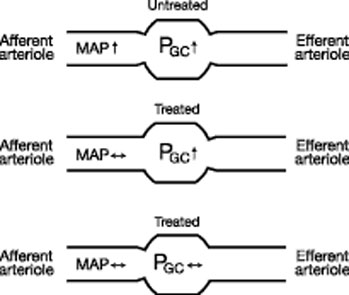
Fig 25. Effect of antihypertensive drugs on systemic and glomerular pressure. Elevated systemic mean arterial pressure (MAP) and glomerular capillary pressure (PGC) in untreated experimental kidney disease (upper panel). Direct-acting vasodilators dilate the afferent arteriole, lowering systemic pressure more than glomerular pressure (middle panel). ACE inhibitors and ARBs selectively dilate the efferent arteriole lowering both systemic and glomerular capillary pressure (lower panel).
In addition, classes of antihypertensive medications differ in other actions, such as release of proinflammatory and profibrotic cytokines. These differences may account, in part, for differences among classes of antihypertensive agents in reducing proteinuria and slowing the progression of kidney disease (Fig 26).
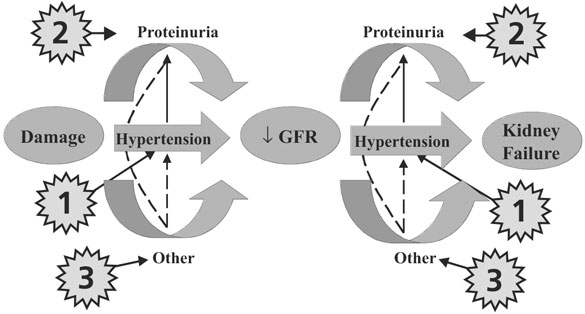
Fig 26. Mechanisms of antihypertensive agents to slow progression of CKD. Putative causal pathways leading to kidney disease progression, including hypertension, proteinuria, and other mechanisms. Antihypertensive agents may slow progression due to their antihypertensive effects (1), antiproteinuric effects (2), and other (class) effects (3).
"Preferred" Antihypertensive Agents for CKD and Use of Antihypertensive Agents in Individuals Without Hypertension
In principle, a class of antihypertensive agents with beneficial effects on the progression of kidney disease by mechanisms in addition to lowering blood pressure would be a "preferred agent" for the treatment of hypertension in CKD. In addition, this class of agents would be indicated, if safe, in individuals with CKD without hypertension. In general, this concept can be expressed as "organ-specific" indications for the use of antihypertensive agents. This concept is well-developed in the field of cardiovascular disease, with such notable examples as ACE inhibitors for treatment of heart failure and beta-blockers and calcium-channel blockers for the treatment of myocardial ischemia, in individuals with or without hypertension. The Work Group reviewed studies of the use of antihypertensive agents for their effects on kidney disease and whether these effects were related to lowering blood pressure and proteinuria. As discussed in Guidelines 8, 9, and 10, ACE inhibitors and ARBs appear to have class effects in certain types of CKD.
A related concept is that class effects may be dose-related (a higher dose conferring a larger benefit). If the class effect is dose-related, then a higher dose of the "preferred" antihypertensive agent would be appropriate to achieve therapeutic goals. Many mechanisms have been proposed to explain class effects of ACE inhibitors and ARBs, including lowering glomerular capillary blood pressure, reducing proteinuria, and other consequences of inhibiting the renin-angiotensin system. It bears emphasis, as discussed in Guideline 11, that in the opinion of the Work Group, the available evidence suggests that class effects of ACE inhibitors and ARBs were related, in part, to dose.
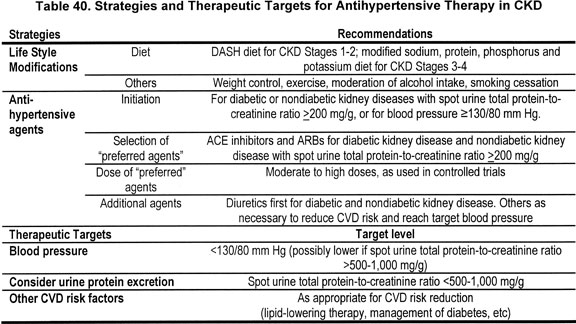
Table 40 summarizes strategies and therapeutic targets for antihypertensive therapy in CKD. The overall goals are to slow GFR decline and reduce CVD risk to the lowest possible levels.
The normal age-related GFR decline is approximately 1 mL/min/1.73 m2 per year. Thus, a therapeutic goal in CKD would be to slow the GFR to <2 mL/min/1.73 m2. However, for a number of reasons, it can be difficult to estimate the rate of decline in GFR in CKD. For example, some interventions that may slow the long-term GFR decline have short-term effects to reduce GFR (including ACE inhibitors, ARBs, strict blood pressure control, dietary protein restriction, and strict glycemic control in diabetes). For slowly progressive disease, months to years of observation may be required before the rate can be estimated accurately.
Risk of coronary heart disease in the absence of CVD or CVD risk factors varies with age from 2% over 10 years at age 30 to 34 to 14% over 10 years at age 70 to 74. In practice, CVD risk is assessed from age and levels of traditional and nontraditional risk factors. However, some studies have suggested that known risk factors explain only half of observed CVD risk.
Rather than set arbitrary goals for GFR decline or CVD risk, the Work Group recommends interventions directed at specific modifiable, intermediate targets during antihypertensive therapy in CKD.
Lifestyle modifications. Guideline 6 discusses dietary modifications appropriate for CKD Stage and other modifications, such as smoking cessation.
Initiation of pharmacological therapy. Guidelines 8, 9, and 10 discuss indications for initiation of antihypertensive therapy in CKD: diabetic kidney disease, nondiabetic kidney disease with proteinuria, or blood pressure ≥130/80 mm Hg.
Selection of "preferred agents" for specific types of CKD. Guidelines 8 and 9 indicate that ACE inhibitors and ARBs are preferred agents for diabetic kidney disease and nondiabetic kidney disease with spot urine total protein-to-creatinine ratio >200 mg/g.
Dose of "preferred agents." Guideline 11 reviews doses of ACE inhibitors and ARBs used in controlled trials.
Additional agents. Guideline 7 indicates that diuretic therapy is preferred for blood pressure control and CVD risk reduction in the general population. Guidelines 8 and 9 indicate that diuretics are the first agents to be added after an ACE inhibitor or ARBs in diabetic kidney disease and nondiabetic kidney disease with spot urine total protein-to-creatinine ratio >200 mg/g. Guideline 12 discusses use of diuretics in CKD.
Blood pressure level. Guideline 7 reviews blood pressure level for cardiovascular disease risk reduction; Guidelines 8, 9, and 10 review blood pressure levels for slowing progression of kidney disease.
Urine protein excretion. Guidelines 8, 9, and 10 discuss antihypertensive agents that reduce proteinuria. It was the opinion of the Work Group that proteinuria should be monitored during the course of CKD, and in patients with spot urine total protein-to-creatinine ratio >500 to 1,000 mg/g, clinicians may consider modifications to antihypertensive therapy, including an even lower target SBP or initiation or increase in dosage of agents that reduce proteinuria.
Other CVD risk factors. Reducing CVD risk depends on a coordinated strategy that integrates antihypertensive therapy with strategies (lifestyle modifications and pharmacological agents) to reduce other CVD risk factors, such as lipid-lowering therapy and management of diabetes.
Because of the older age of onset of many kidney diseases, the slow mean rate of decline of kidney function, and high death rate due to CVD, it is likely that most individuals with CKD do not develop kidney failure. For example, in about 1991, the midpoint of the NHANES III survey, the estimated prevalence of CKD Stage 3 (7.6 million individuals, approximately 4.3% of the US adult population, Table 26) was approximately 150 times greater than the annual incidence of kidney failure (50,000 individuals, approximately 0.02%). In all likelihood, most individuals with CKD Stage 3 do not progress to kidney failure; rather, they die from the more serious complications of CVD, before the onset of kidney failure. From the discussion above, the most likely cause of death is CVD. Thus, CVD is a "competing risk" for kidney failure in CKD. Patients with a higher risk of death from CVD might not survive long enough to develop kidney failure. As a corollary, a decrease in the death rate from CVD in due to risk factor reduction or improved treatment might lead to an increased risk of kidney failure in patients with both CVD and CKD.
Figure 27 shows a schematic diagram of the population with CKD and CVD, emphasizing similarities in stages of progression, shared risk factors, and the much larger number of individuals with earlier versus later stages of disease.25 In each stage, ASCVD events are the leading cause of death. Decreased GFR is associated with a wide range of complications, such as hypertension, anemia, malnutrition, bone disease, neuropathy, and decreased quality of life. The contributions of these disorders to CVD and other causes of death in earlier stages of CKD has not been systematically studied.
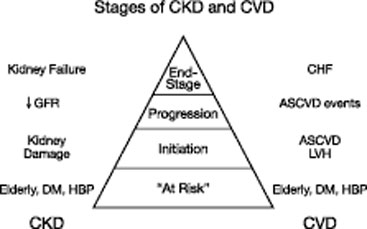
Fig 27. Schematic diagram of population with CKD and CVD. Reproduced with permission.25
Appropriate antihypertensive therapy holds the promise of improving outcomes in CKD by lowering blood pressure, slowing progression of kidney disease, and reducing CVD risk. However, the Work Group acknowledges the possibility that discrepancies may arise among these therapeutic goals at various times in individual patients. Clinical judgment is necessary to determine which of these goals has the highest priority during the course of CKD. This concept is discussed more in Guideline 1.
Interpretation of controlled trials of antihypertensive therapy in CKD can be complex. Even controlled trials with excellent design and conduct are generally able to answer only a narrow question. Thus, evidence synthesis for development of clinical practice guidelines requires a large evidence base consisting of large number of controlled trials, supplemented with meta-analyses, comparisons across trials, and observational studies.
Selection of Therapeutic Targets for Intervention
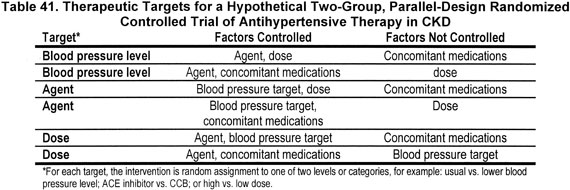
A large number of controlled trials have been completed in recent years. Most of these studies have focused either on the blood pressure level or class of antihypertensive agents. In a few trials, the dose of the antihypertensive agent has been studied. No studies have targeted the level of urine protein.
However, it is not possible in a clinical trial of antihypertensive agents to simultaneously control for (1) blood pressure level during follow-up, (2) class of antihypertensive agents of interest, (3) dose of antihypertensive agents, and (4) concomitant antihypertensive agents during follow-up. Table 41 shows controlled and uncontrolled factors in a hypothetical randomized controlled trial using a two-group parallel randomized design with interventions directed at various targets. These study designs test two levels or categories of intervention on the therapeutic target, while controlling the factors of interest. However, they do not allow inferences about factors that are not controlled, which may themselves affect outcome. Thus, it can be difficult to generalize the results of any individual trial.
Selection of Level of Intervention
Progress in identifying efficacious therapies can narrow the choices for future studies. For example, if one class of antihypertensive agent is shown to be effective in a "head-to-head" comparison with an alternative agent for a type of kidney disease, questions arise regarding the ethics of withholding the effective agent in comparison to a different alternative agent, or in a different type of kidney disease. Ethical dilemmas can also arise when investigating the level of blood pressure in various types of kidney disease.
Selection of Study Population and Outcome Measures
The competing risks of progression of kidney disease and CVD in CKD require consideration of both outcomes during the trial. The event rate for each outcome reflects the underlying risk of the population, based on eligibility and exclusion criteria. No study has included a sufficient number of patients at increased risk of both outcomes, including subgroups of patients with different levels of underlying risk. In general, studies of kidney disease progression have excluded patients with a high risk of CVD, and studies of CVD have excluded patients with a high risk of kidney disease progression. This has led to conflicting conclusions about the net health benefits of the interventions, when considering the spectrum of patients with CKD, who are at risk of both kidney disease progression and CVD.